

Credit: Unsplash
This article was produced by the Ministry of Business, Innovation and Employment (MBIE). The content you find below is exclusive to the Tourism Evidence and Insights Centre.
This commentary presents the national context for tourism in the year ending March 2019 (and for the March 2019 quarter where available). The main tourism measures are showing slight growth across the New Zealand tourism industry, strengthened by growth in visitors from outside the top six markets, as well as relatively favourable exchange rates.
The Tourism Data Domain Plan (TDDP) sets out the main priorities for improving tourism statistics, based on agreement by industry and government stakeholders. The QTR fills some gaps identified in the TDDP. In particular, the QTR aims to improve data usability and capability within the sector. The QTR assists in the following specific initiatives:
The commentary below presents the national context for tourism in the year ending March 2019 (and for the March 2019 quarter where available). The key findings are listed below and expanded on the following sub-sections:
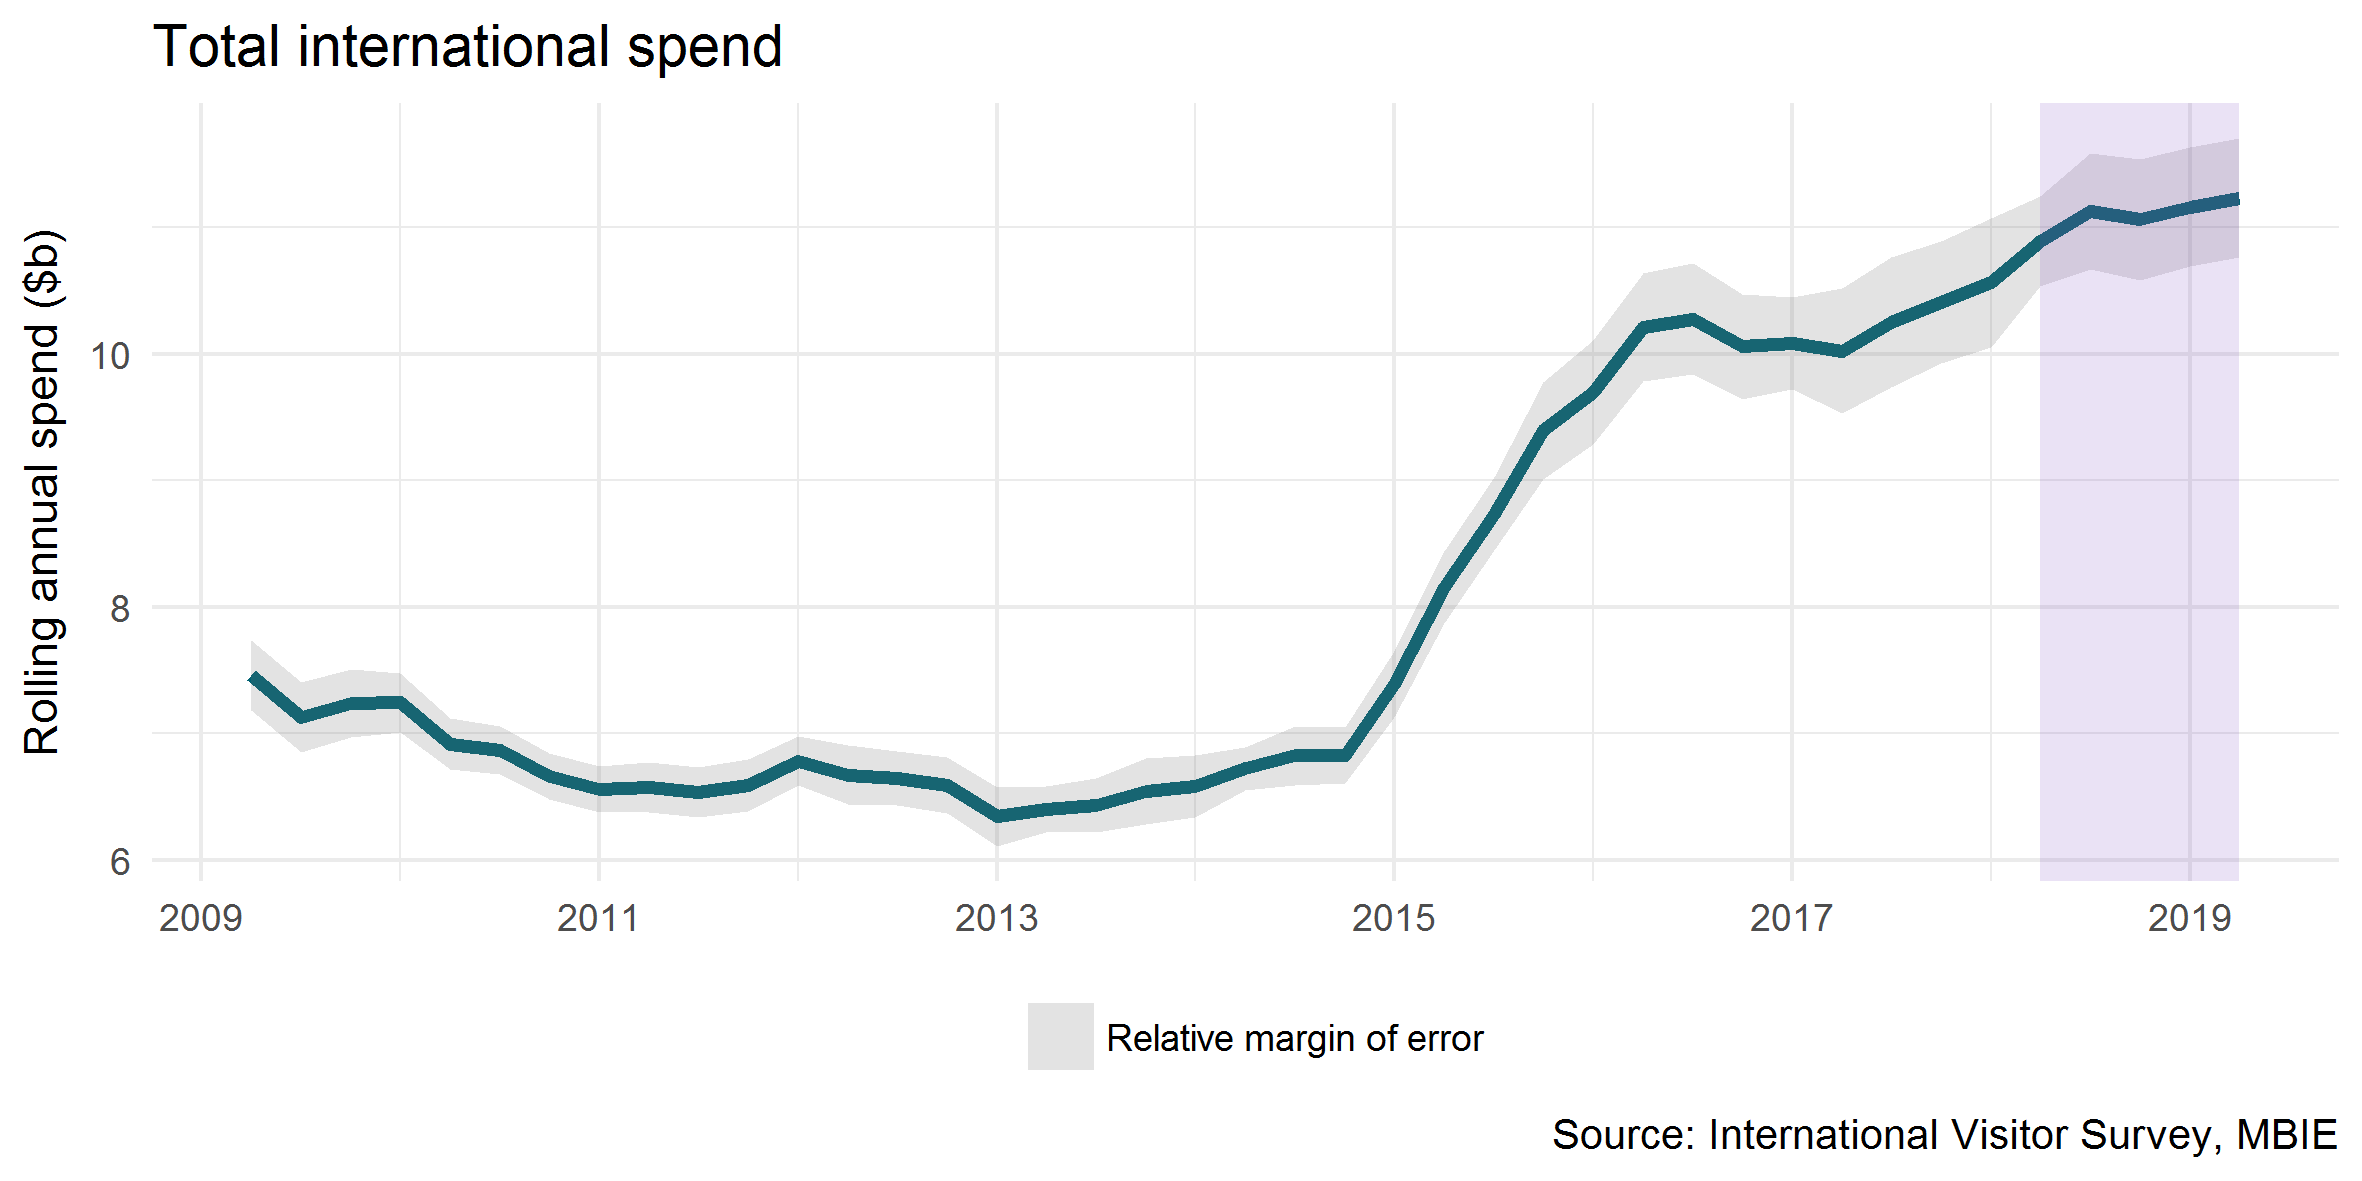
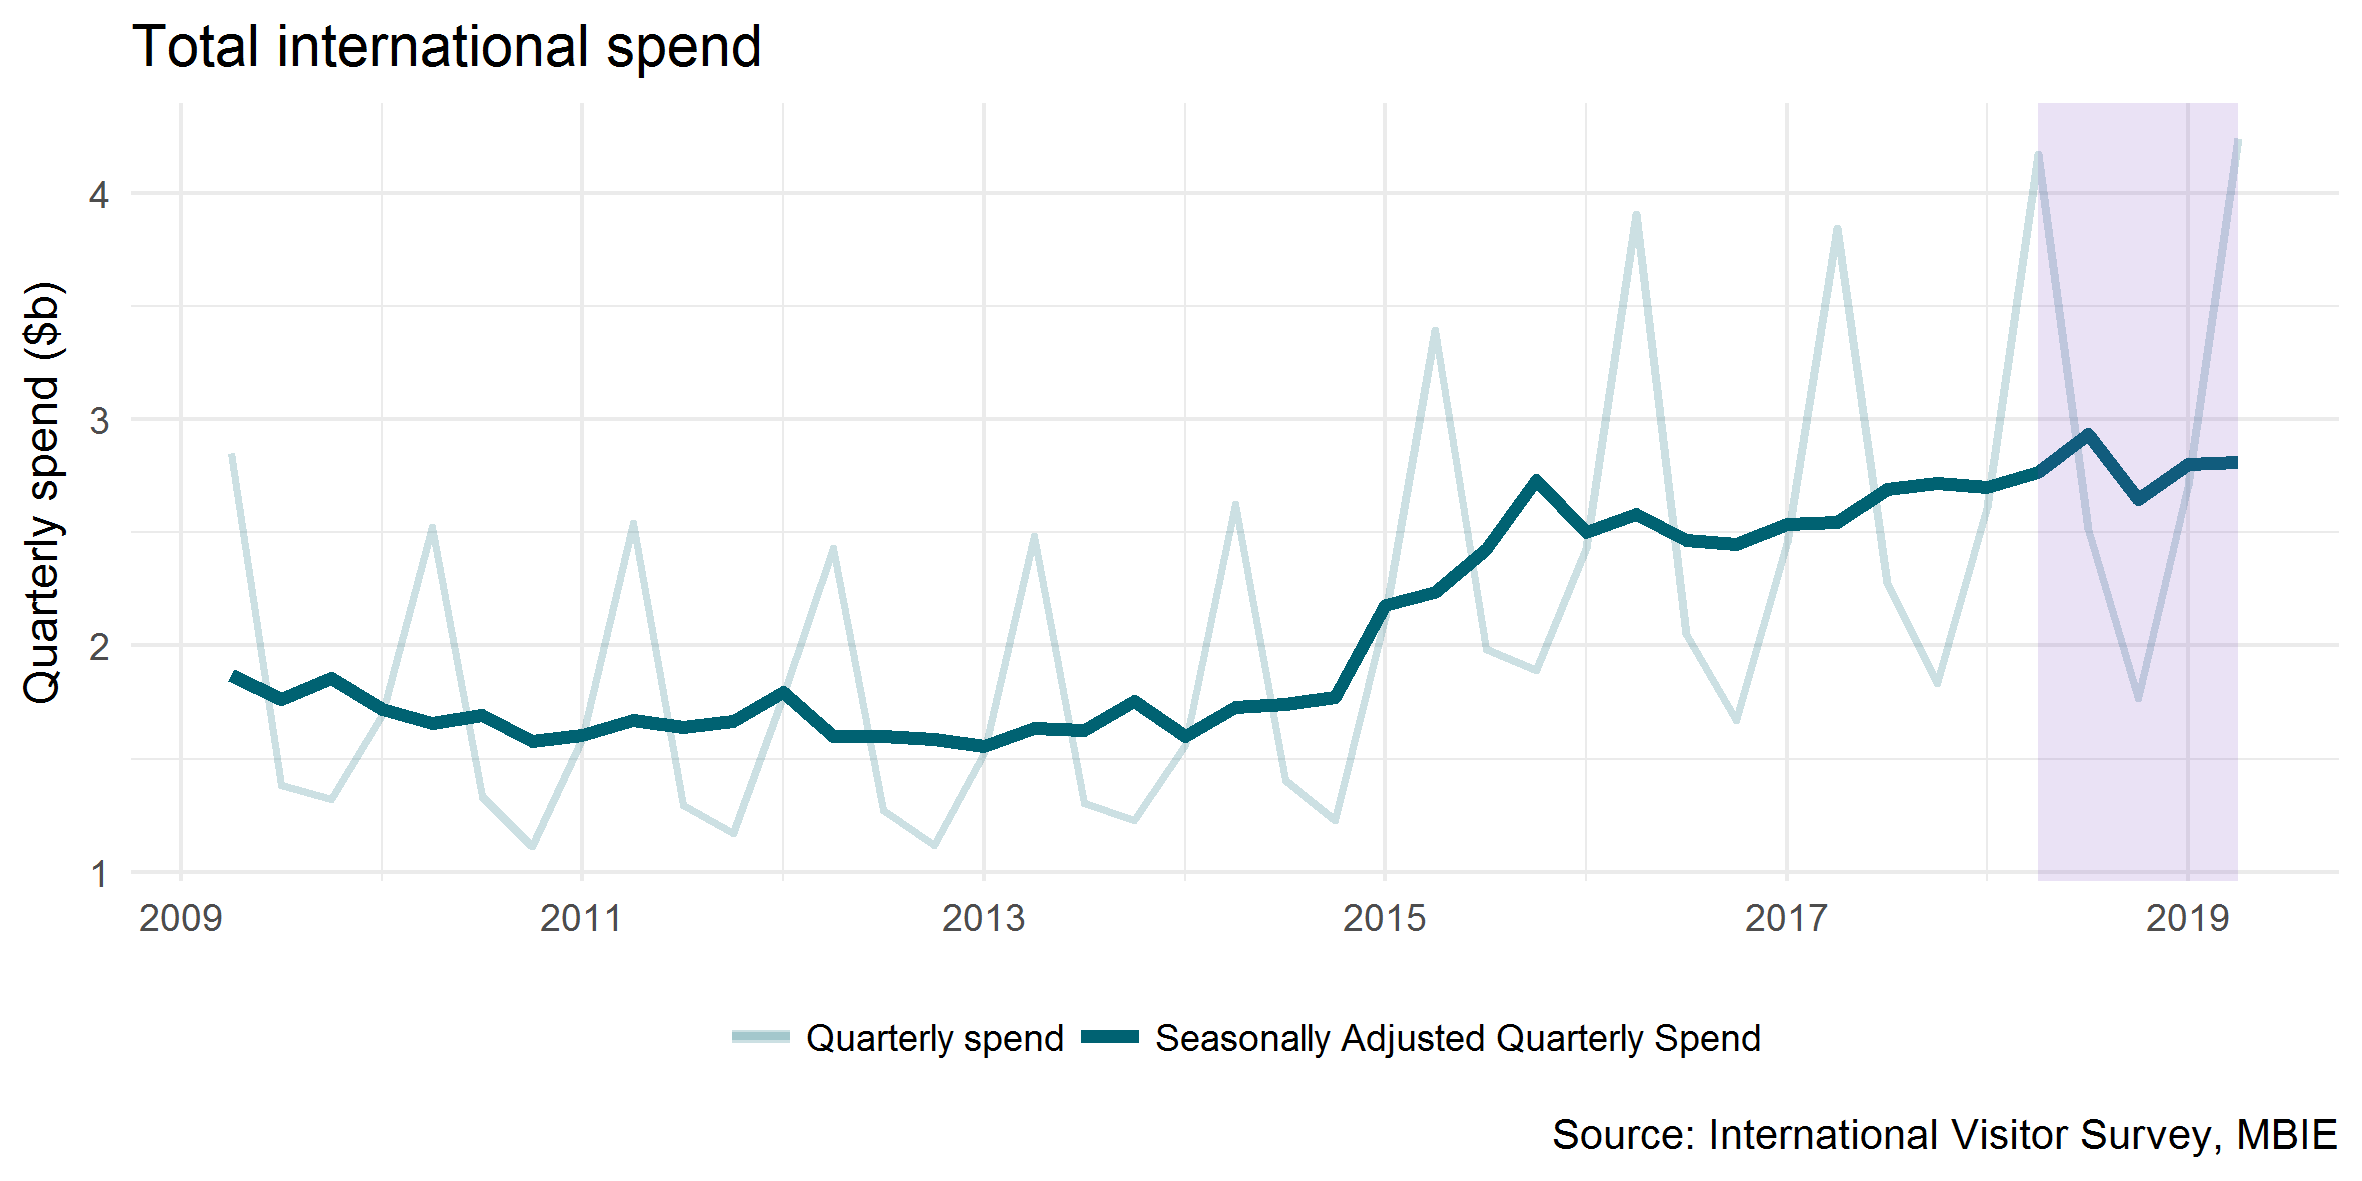
Spend by international visitors in New Zealand grew three per cent to $11.2 billion for the year ending March 2019. This equated to an overall increase of $342 million over the year (although the growth was not statistically significant).
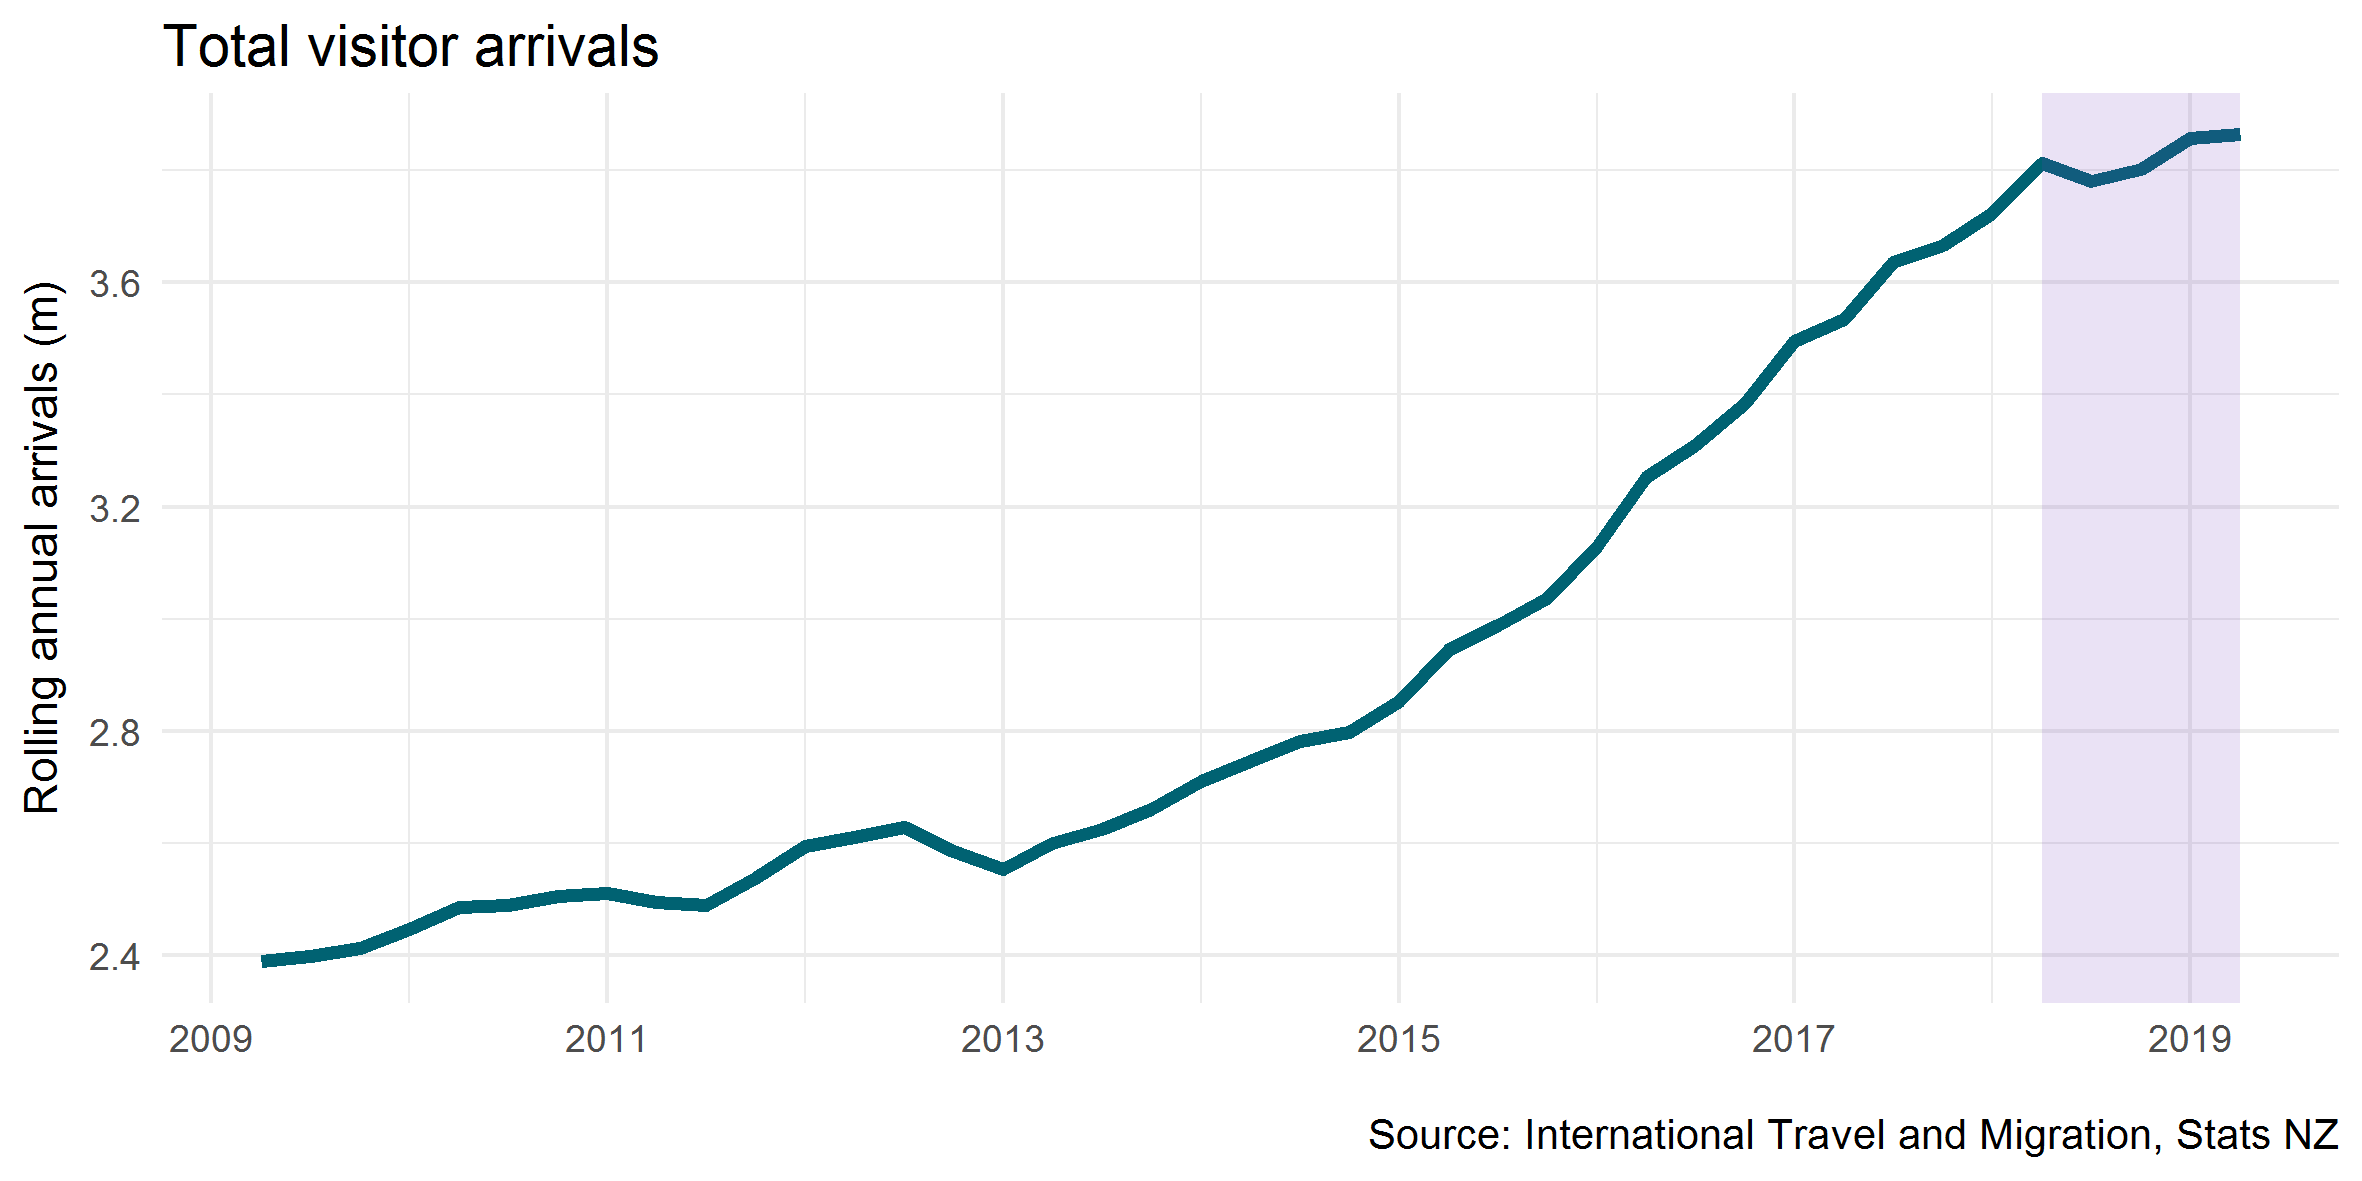
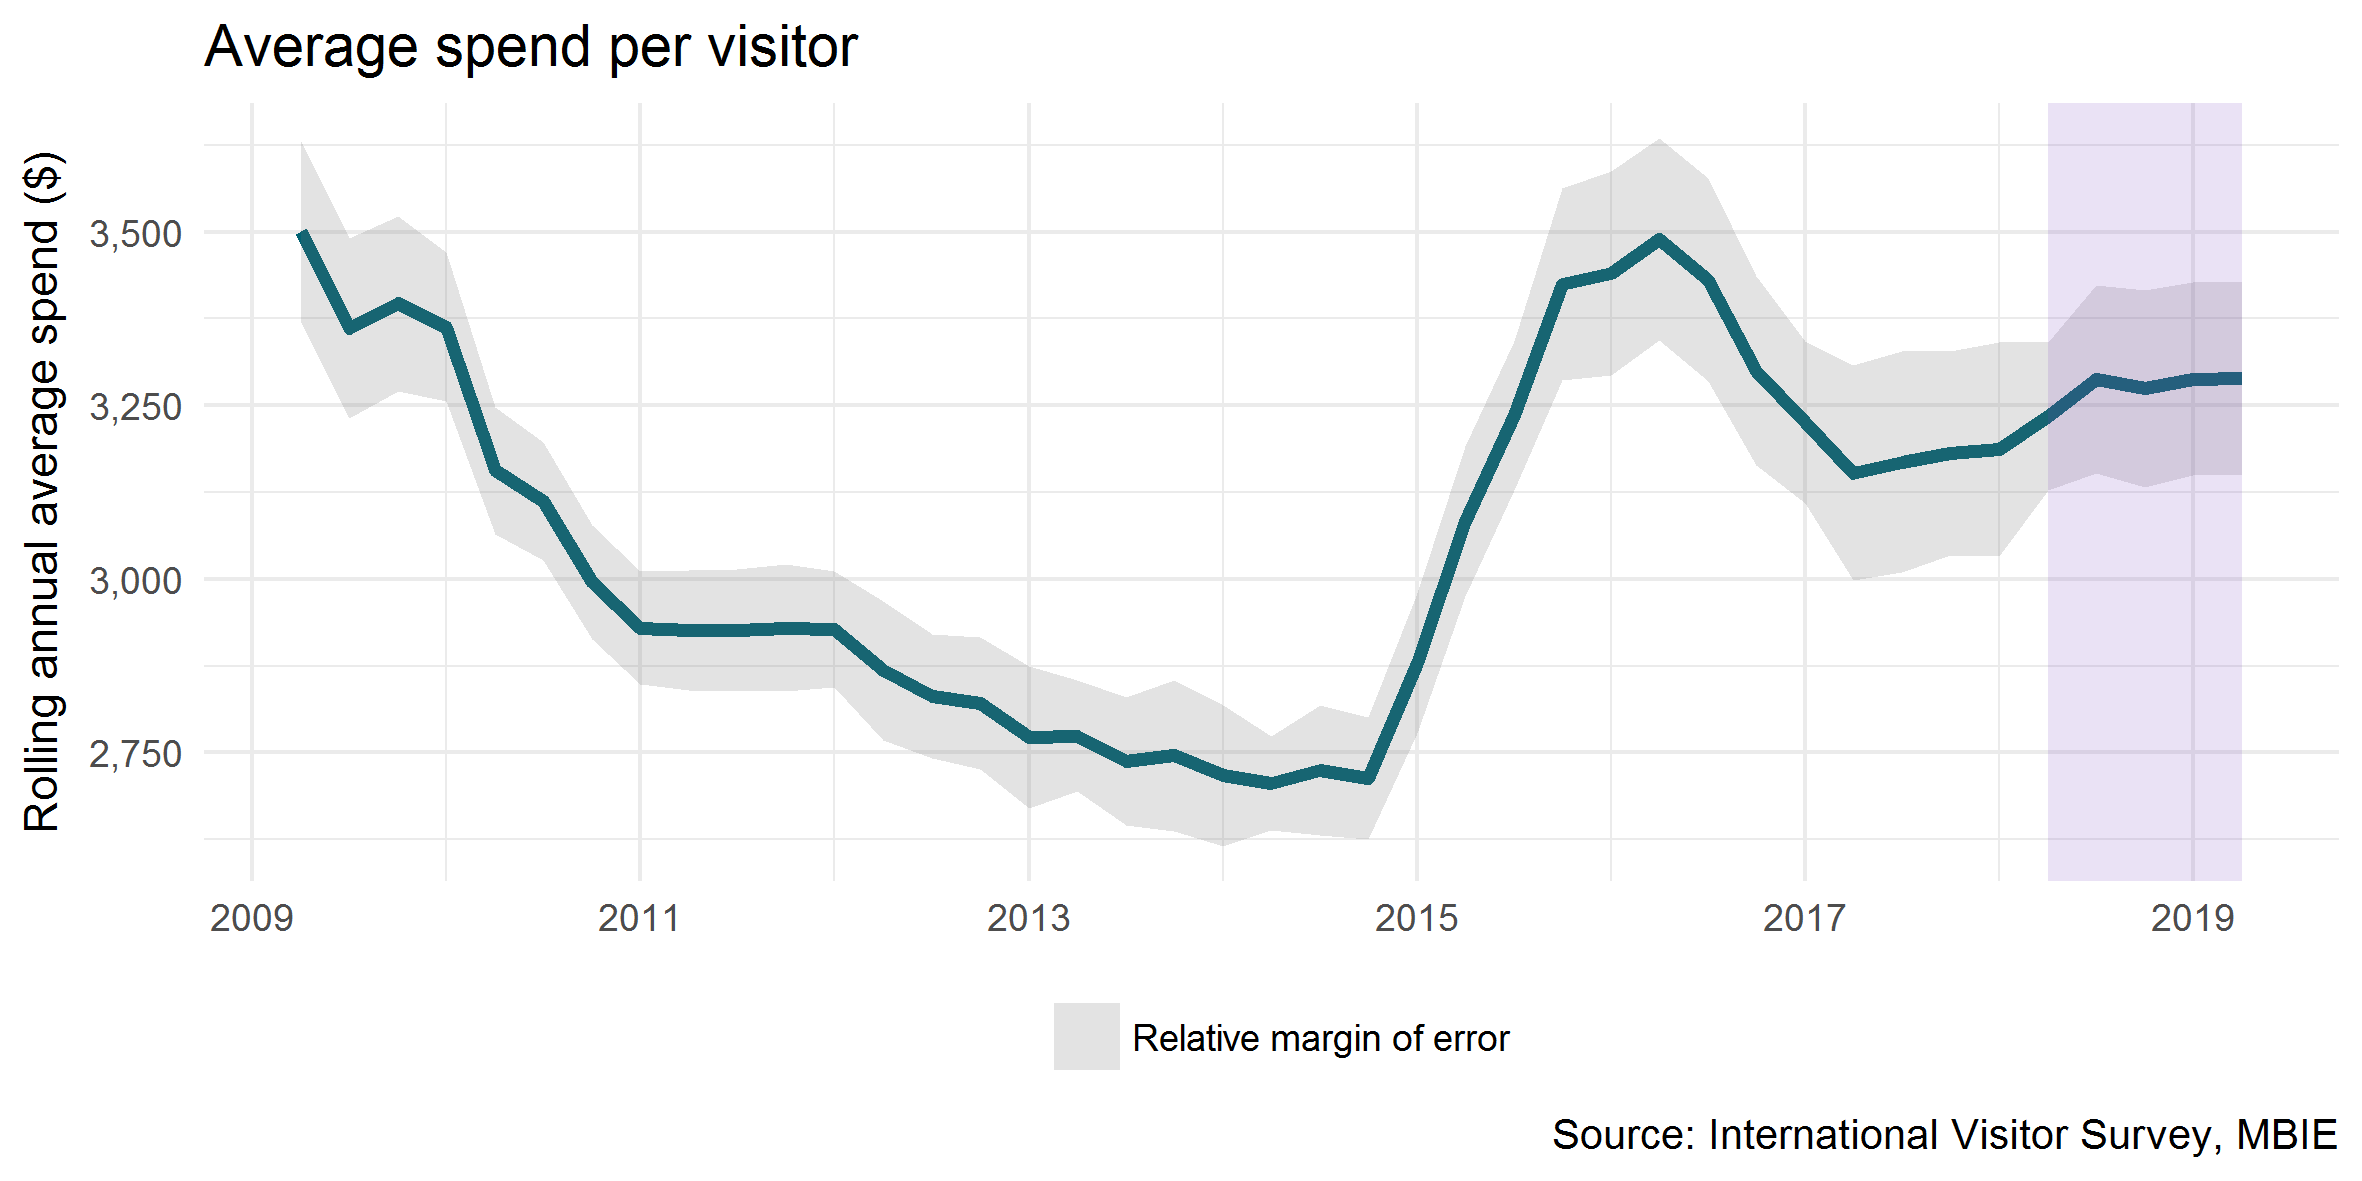
Over the same period, the number of international visitors increased by one per cent to 3.9 million. Spend grew slightly faster than visitor numbers, due to a two per cent increase in average spend per visitor (up to $3,300).
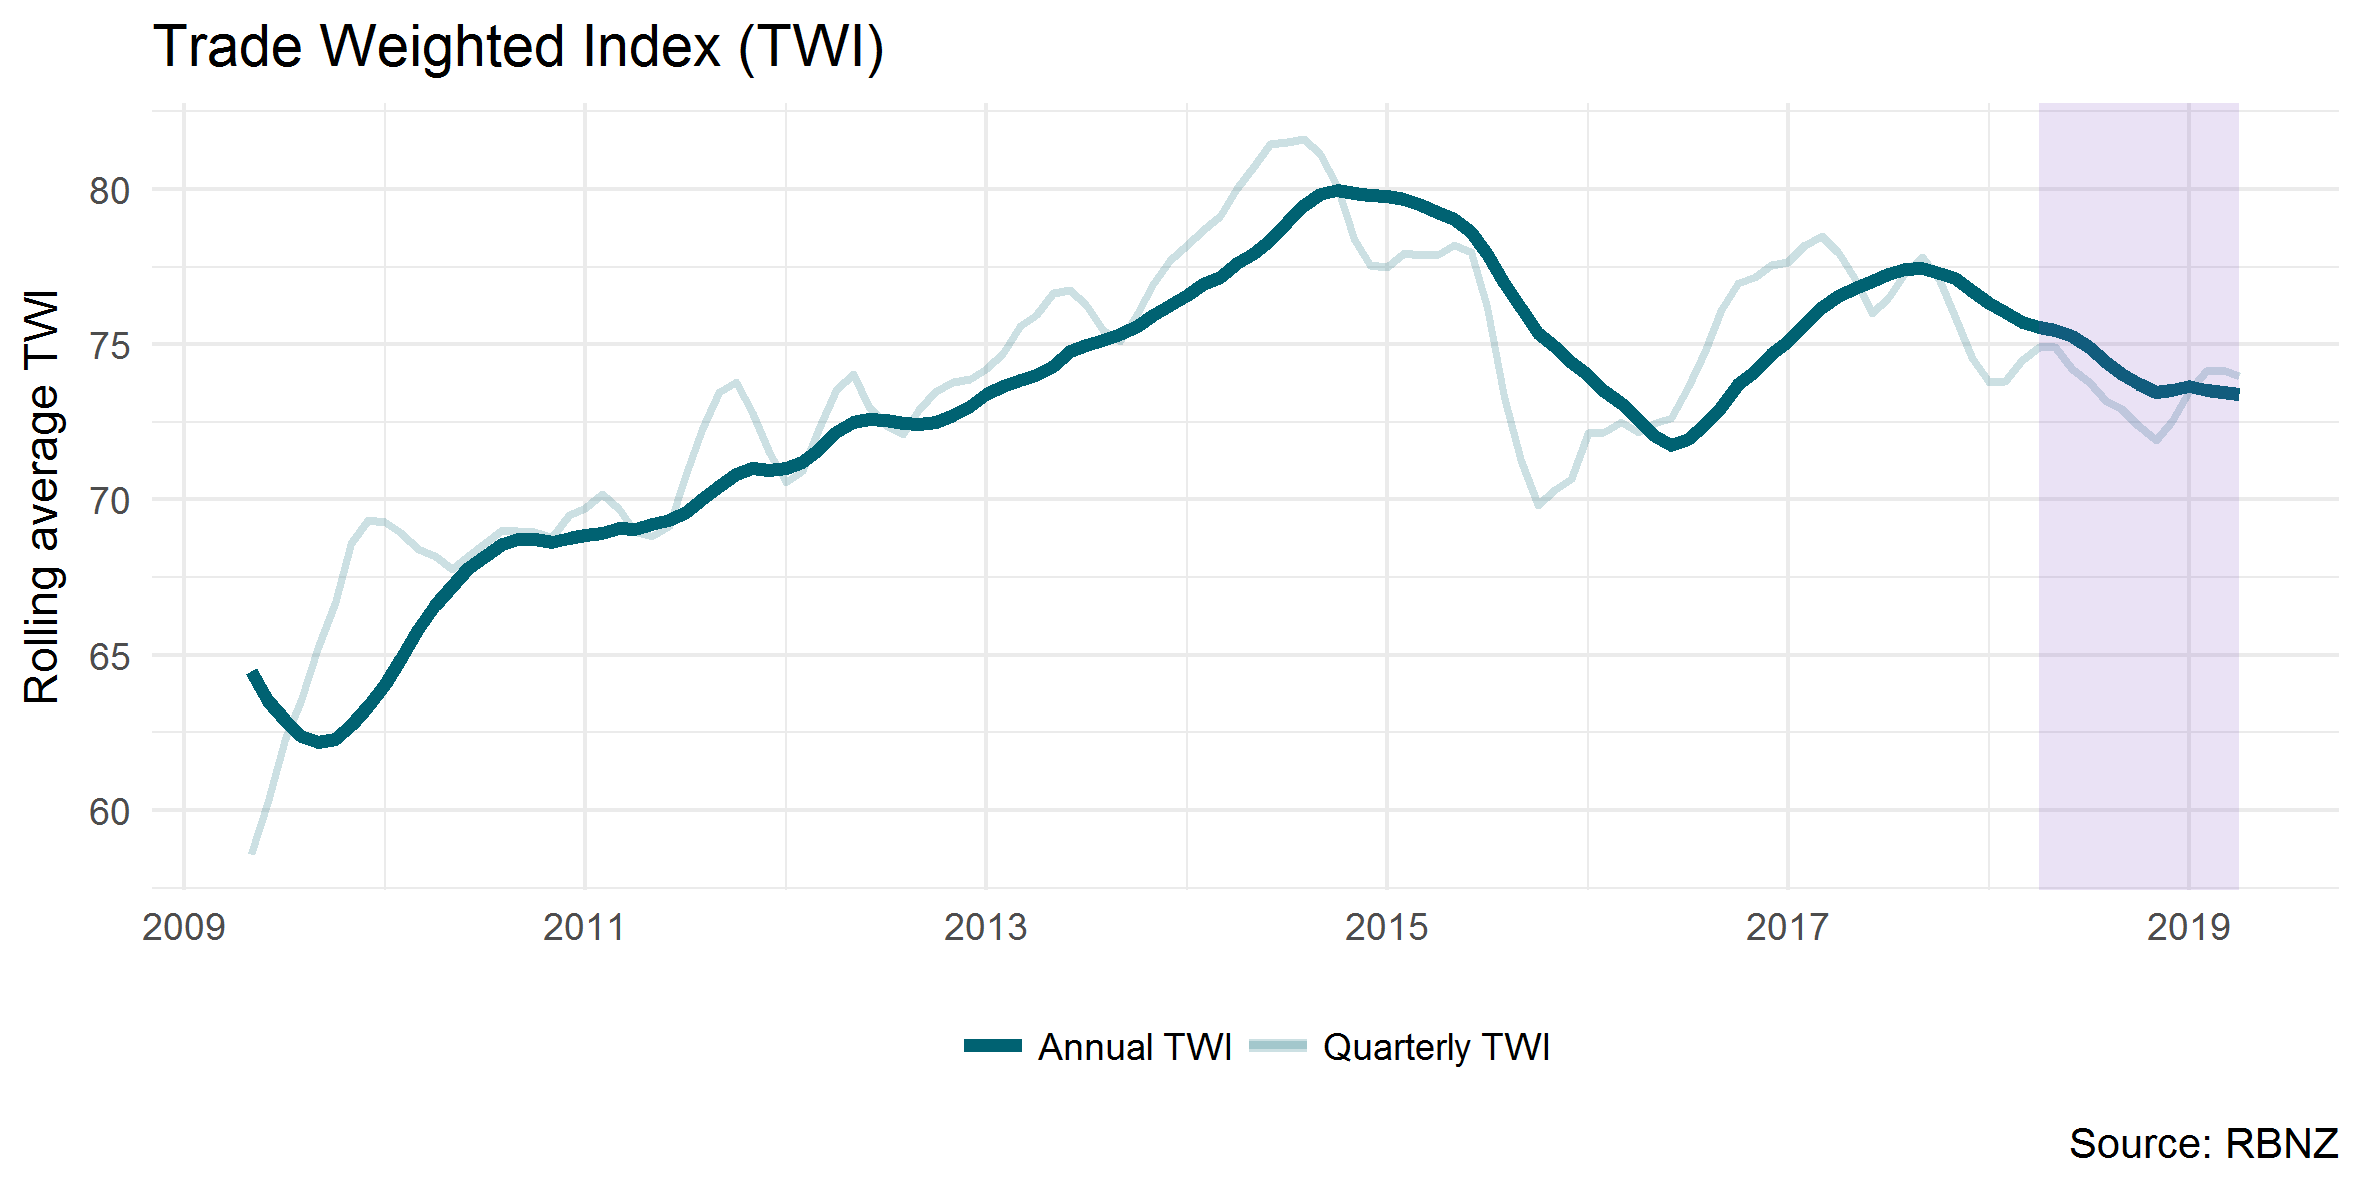
One reason for the increase in average spend is likely to have been the fall in the New Zealand dollar against many of our major tourism markets over the year. This fall increased the purchasing power of visitors, allowing them to spend more in New Zealand dollars for the same amount of their home currency.
The following graph shows that the annual Trade Weighted Index (TWI) fell three per cent for the year ended March 2019. The TWI is an index showing the value of the New Zealand dollar in relation to our major trading partners.
After adjusting for seasonal impacts, international visitor spend remained unchanged for the March 2019 quarter, when compared with the December 2018 quarter.
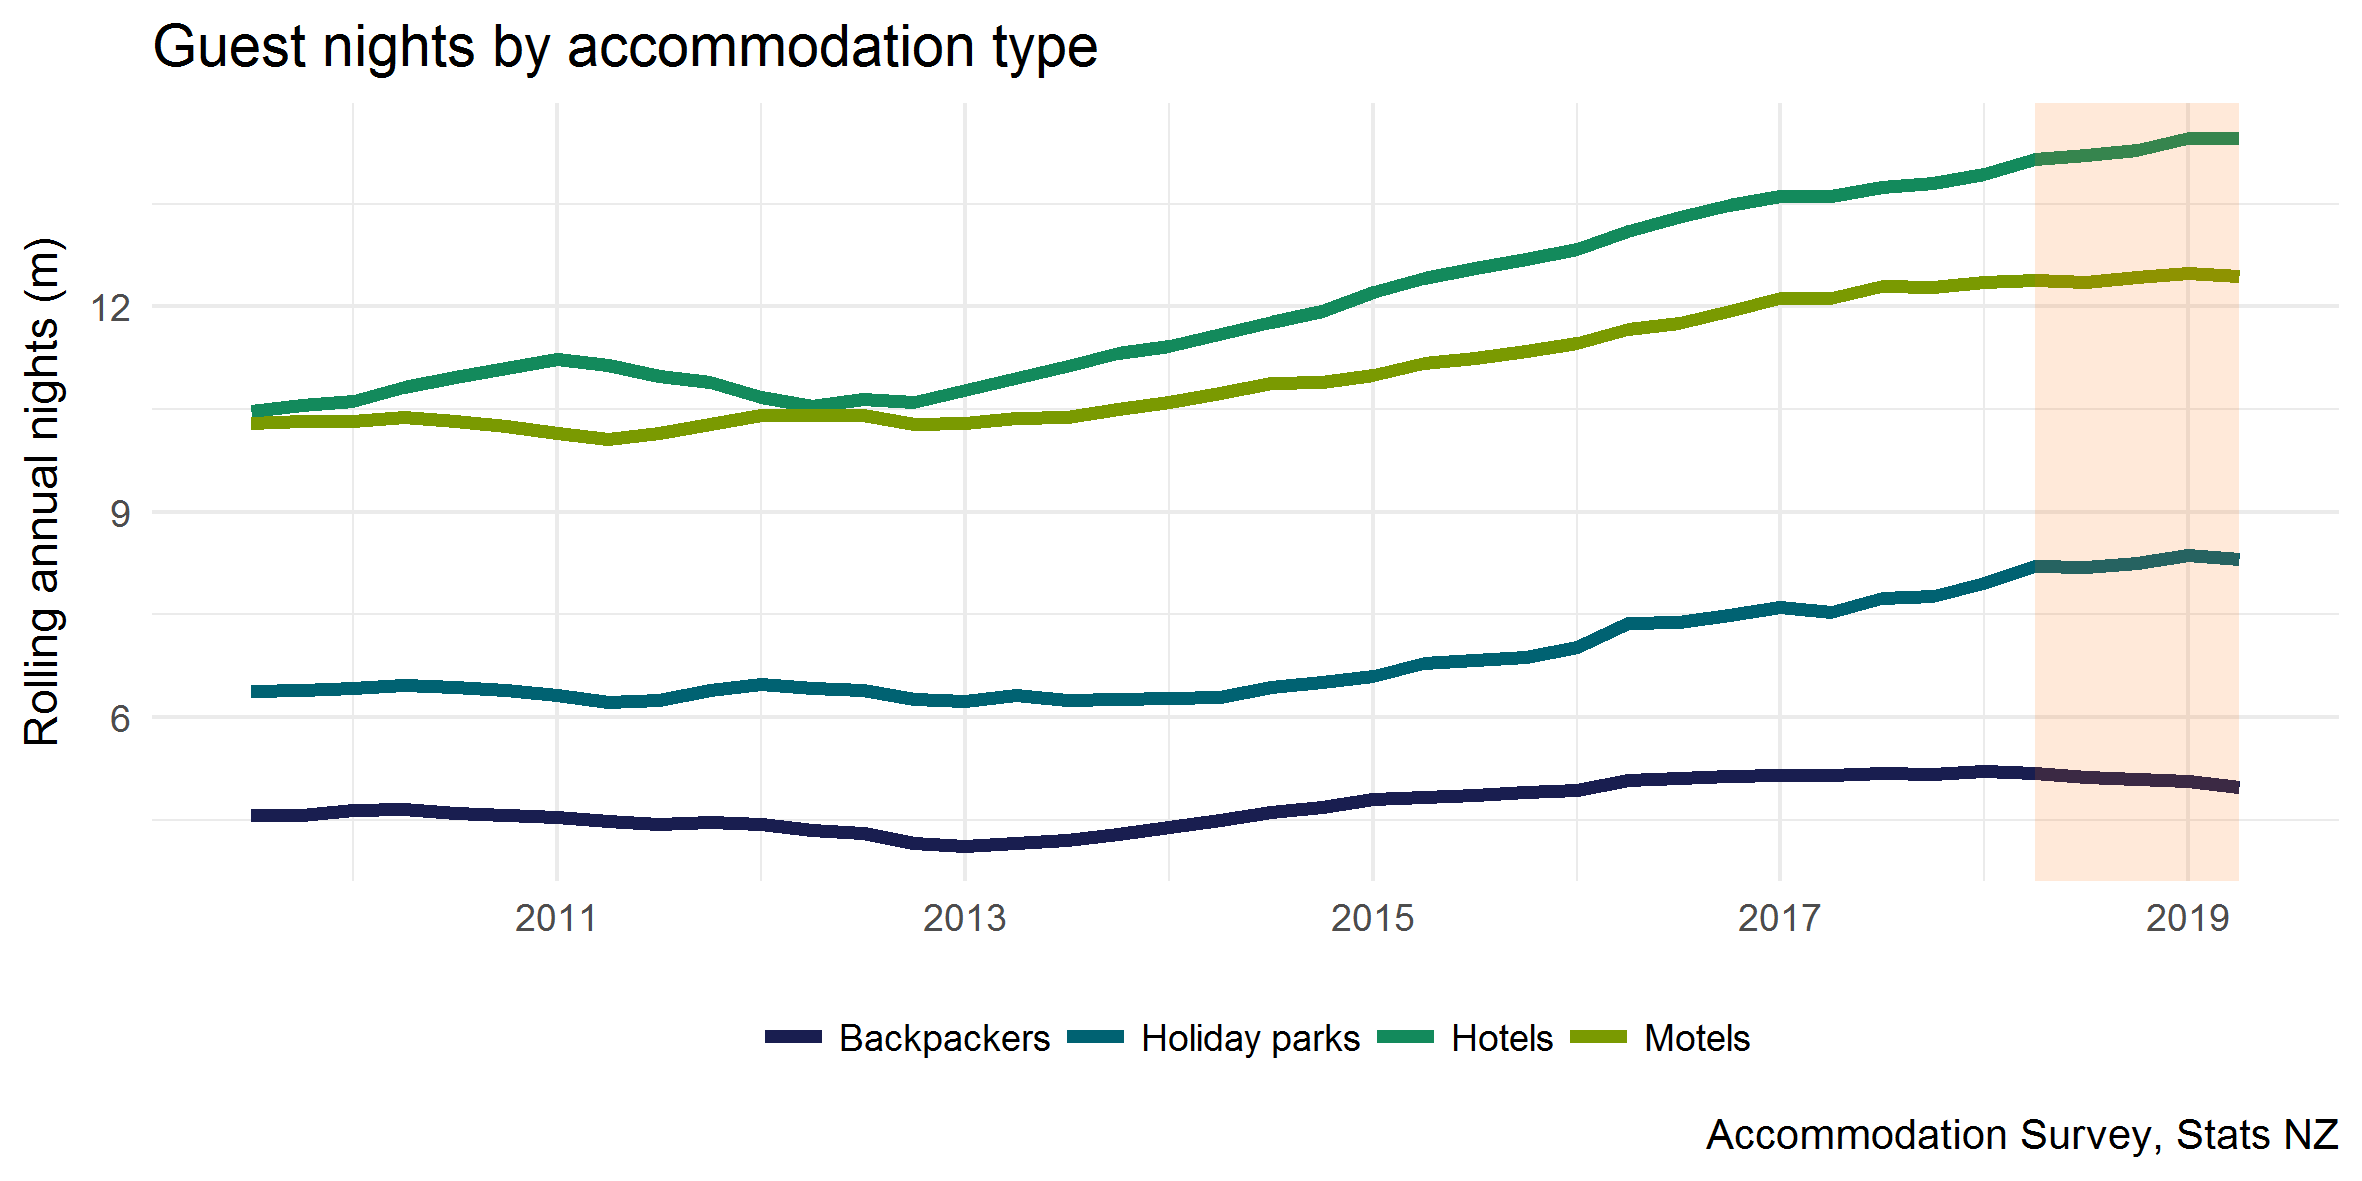
There were 40.2 million guest nights in measured commercial accommodation (hotels, motels, backpackers and holiday parks) in the year ended March 2019, up one per cent (or 260,000) from the previous year. This figure includes both domestic (up 2.1 per cent) and international (down 1.2 per cent) visitors. Domestic visitors make up approximately 60 per cent of all guest nights.
Backpackers contributed the most to the fall in international visitor nights, down 229,000 (6.1 per cent). This was followed by motels, down 78,000 (1.8 per cent) and holiday parks, down 36,000 (1.6 per cent).
Please note that this measure is partial, and does not include guest nights in hosted accommodation, such as homes rented through a peer-to-peer network such as Airbnb. It also does not include guest nights in holiday homes or people staying with friends and family.
The commentary below presents the national context at the country level for tourism in the year ending March 2019 (and for the March 2019 quarter where available). The key findings are listed below and expanded on the following sub-sections:
Most of New Zealand’s large tourism markets showed little change in spend in the year ended March 2019. Australian spend increased two per cent (to $2.65 billion) while Chinese spend fell two per cent (to $1.63 billion).
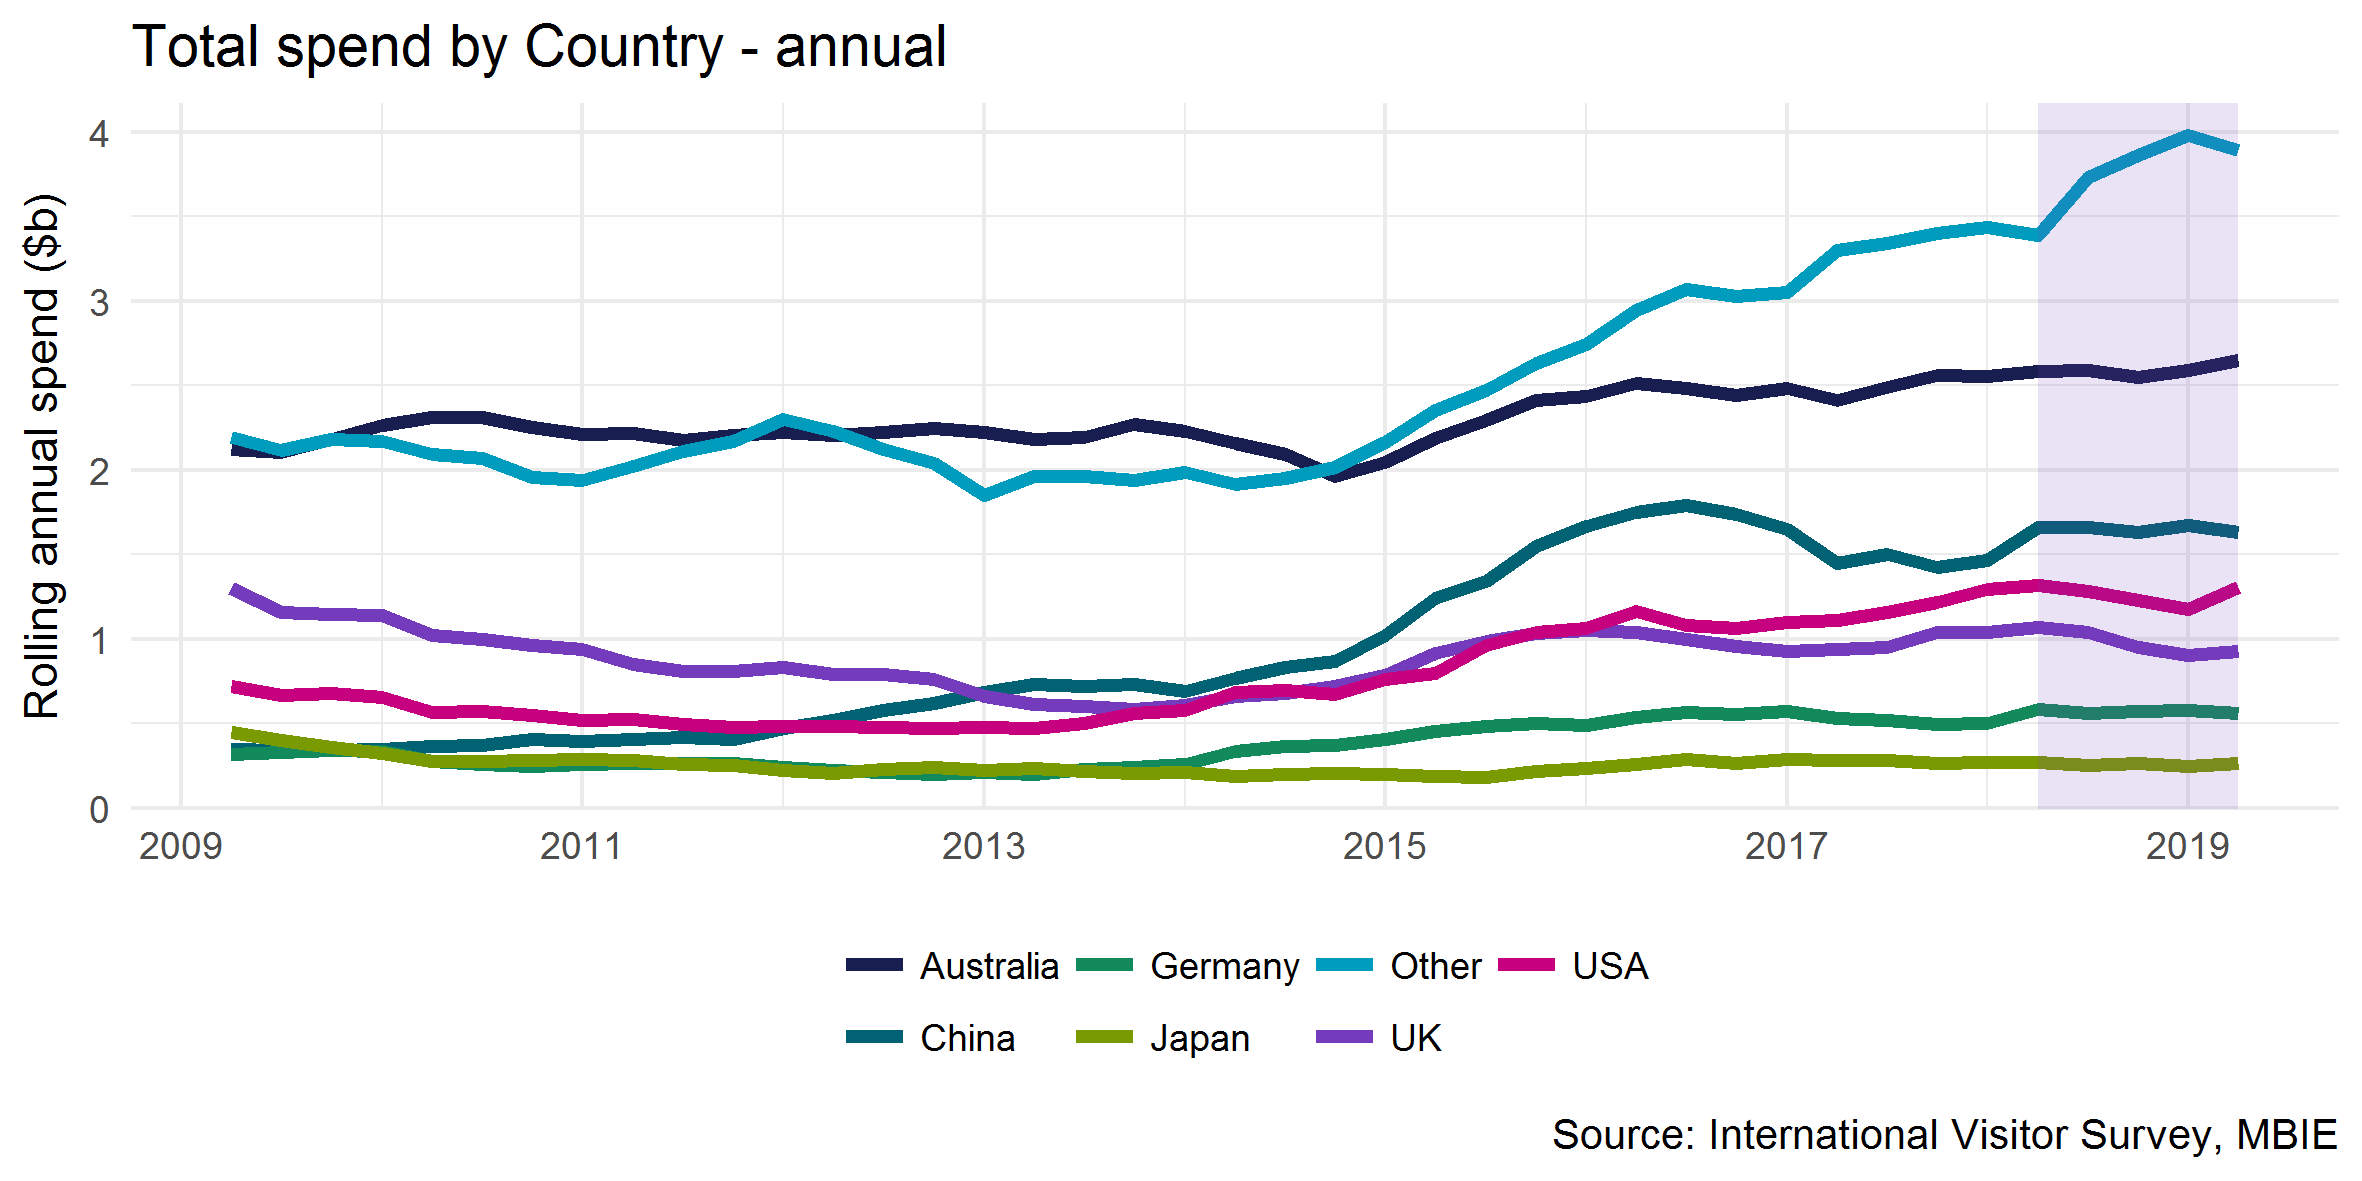
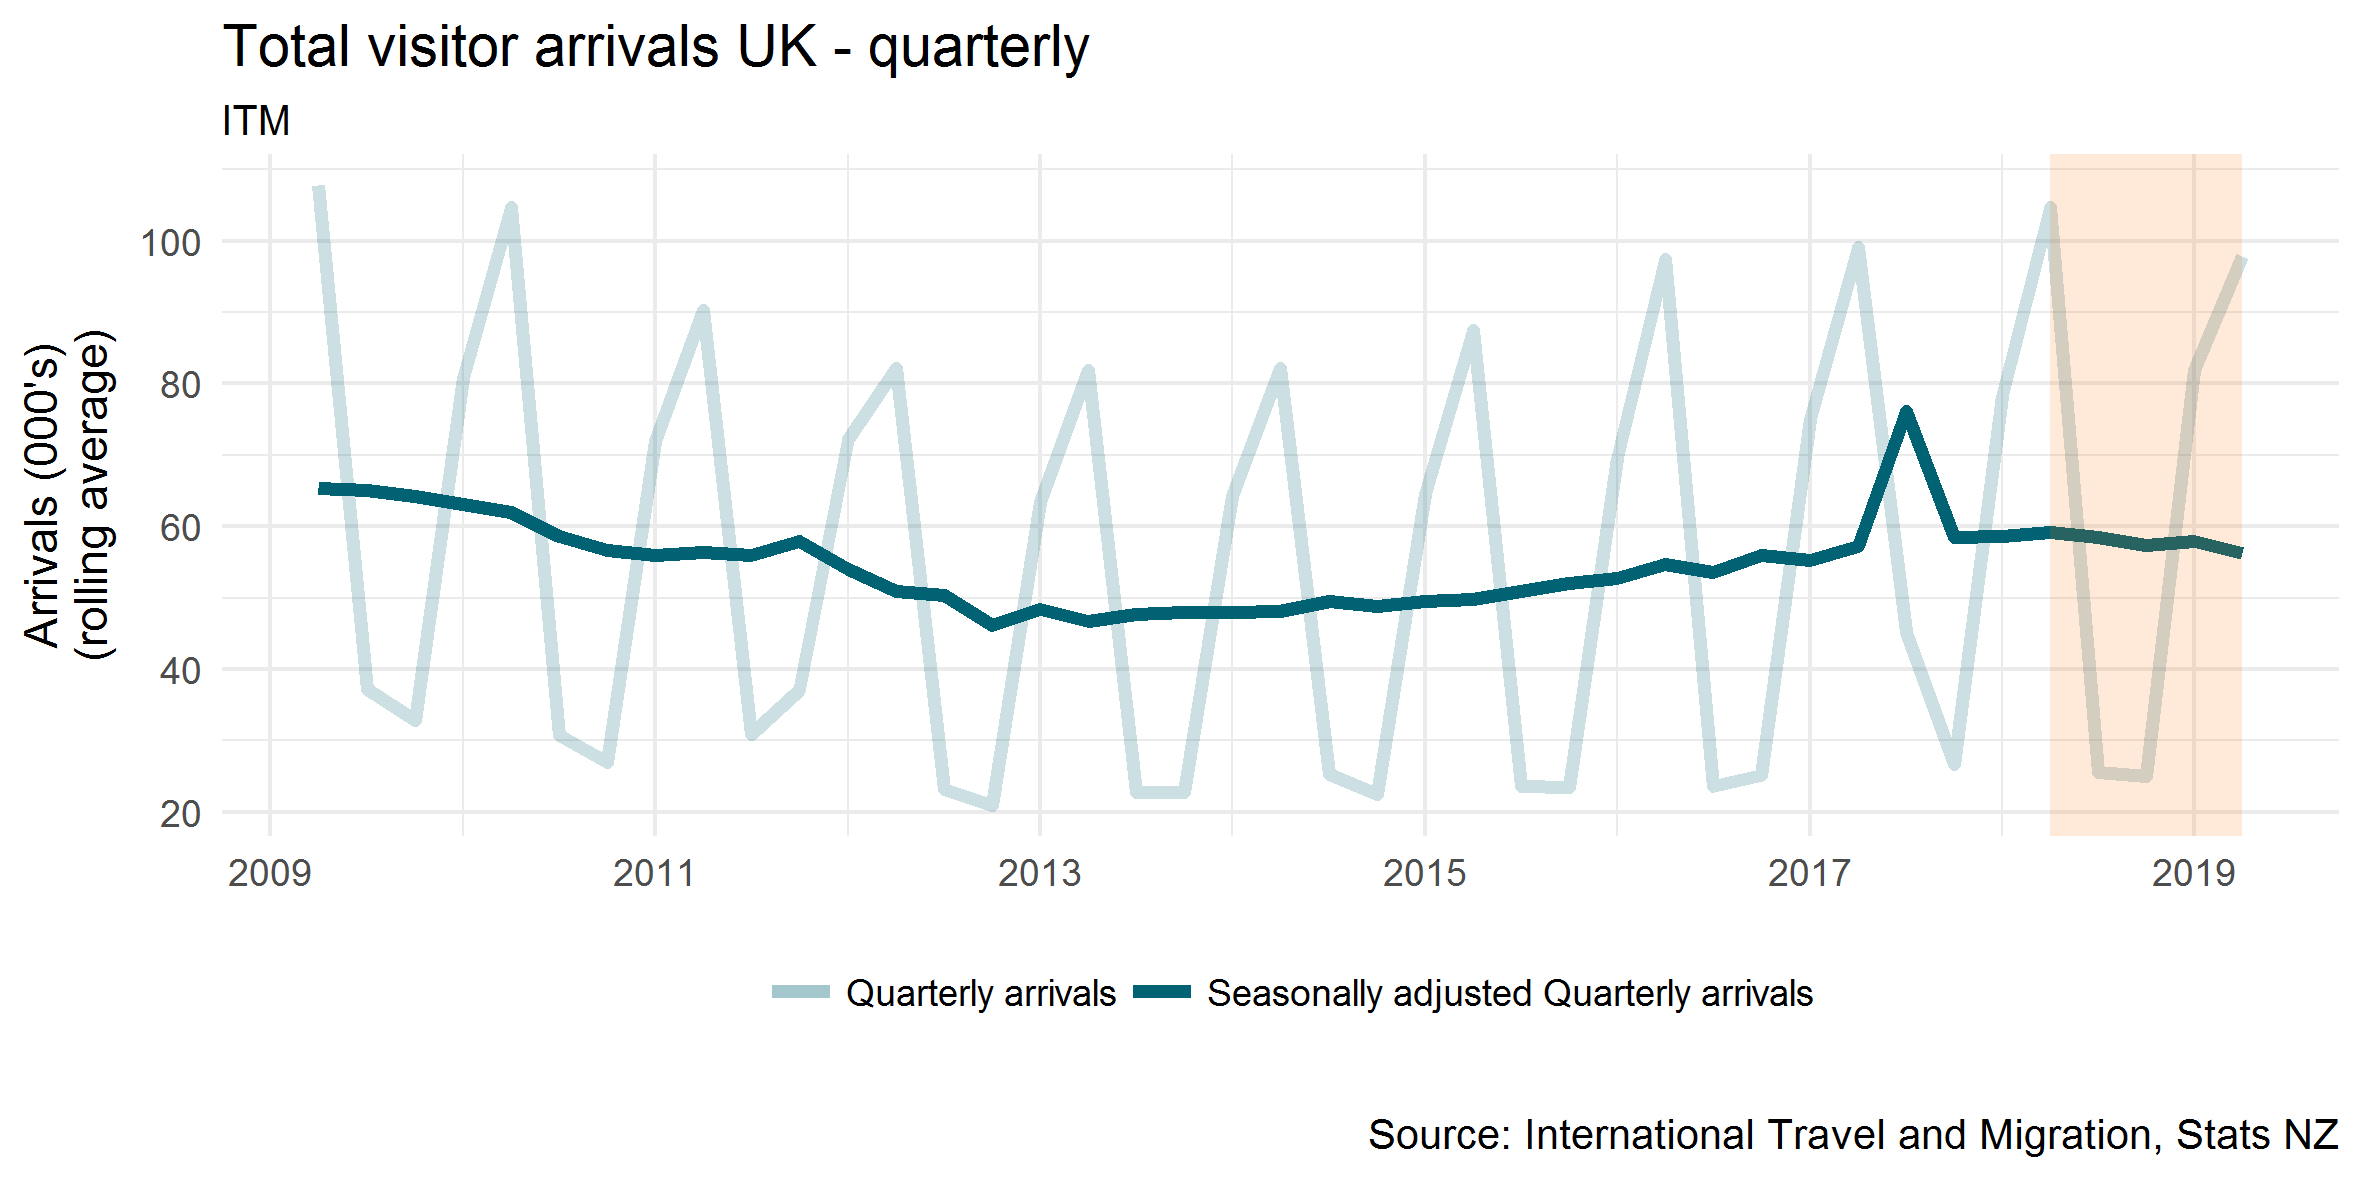
Spend from UK visitors fell 13 per cent in the year ended March 2019. This was due to a 10 per cent fall in arrivals and an 8 per cent fall in average spend. Although the majority of the fall was due to the DHL British and Irish Lions Series that was held in mid-July 2017, arrival numbers (when seasonally adjusted) have been trending down slightly over the year ended March 2019.
The growth in spend relied heavily on markets outside our largest six. Even though spend increased $343 million in the year ended March 2019 overall, spend outside the top six markets increased by $504 million. Spend by Other Asia countries (excluding China, Korea and Japan) made up a large proportion of this increase, up 15 per cent in the year to $1.3 billion.
Other Asia countries also continue to be a major source of growth for international visitors. While other Asian countries’ visitor numbers remain smaller than our main tourism markets, there has been considerable growth over the year. For example, visitors from India grew 8 per cent to 68,000, Taiwan grew 27 per cent to 48,000, the Philippines grew 10 per cent to 28,000 and Indonesia grew 9 per cent to 26,000.
The commentary below presents the regional context for tourism in the year ending March 2019 (and for the March 2019 quarter where available). The key findings are listed below and expanded in the following sub-sections:
Most regions achieved growth in tourism spend in the year ended March 2019. The fastest-growing regions were Gisborne (up 11.6 per cent), Taranaki (up 7.0 per cent) and Wellington (up 6.3 per cent).
The West Coast and Northland were two regions where spend fell in the period, down 2.5 percent and 0.1 per cent respectively.
The horrific terror attacks in Christchurch in mid-March have had a huge impact on so many people, as well as the city and New Zealand as a whole. However, at least up to the end of April 2019, this hasn’t translated into a measurable effect on international or domestic tourism spending, in the Christchurch City Territorial Authority (TA) or in the rest of New Zealand. International visitor spending in Christchurch has continued to rise. However, these visitors are likely to book flights months in advance, and so any effects on arrivals and spend may not be seen until further into the future.
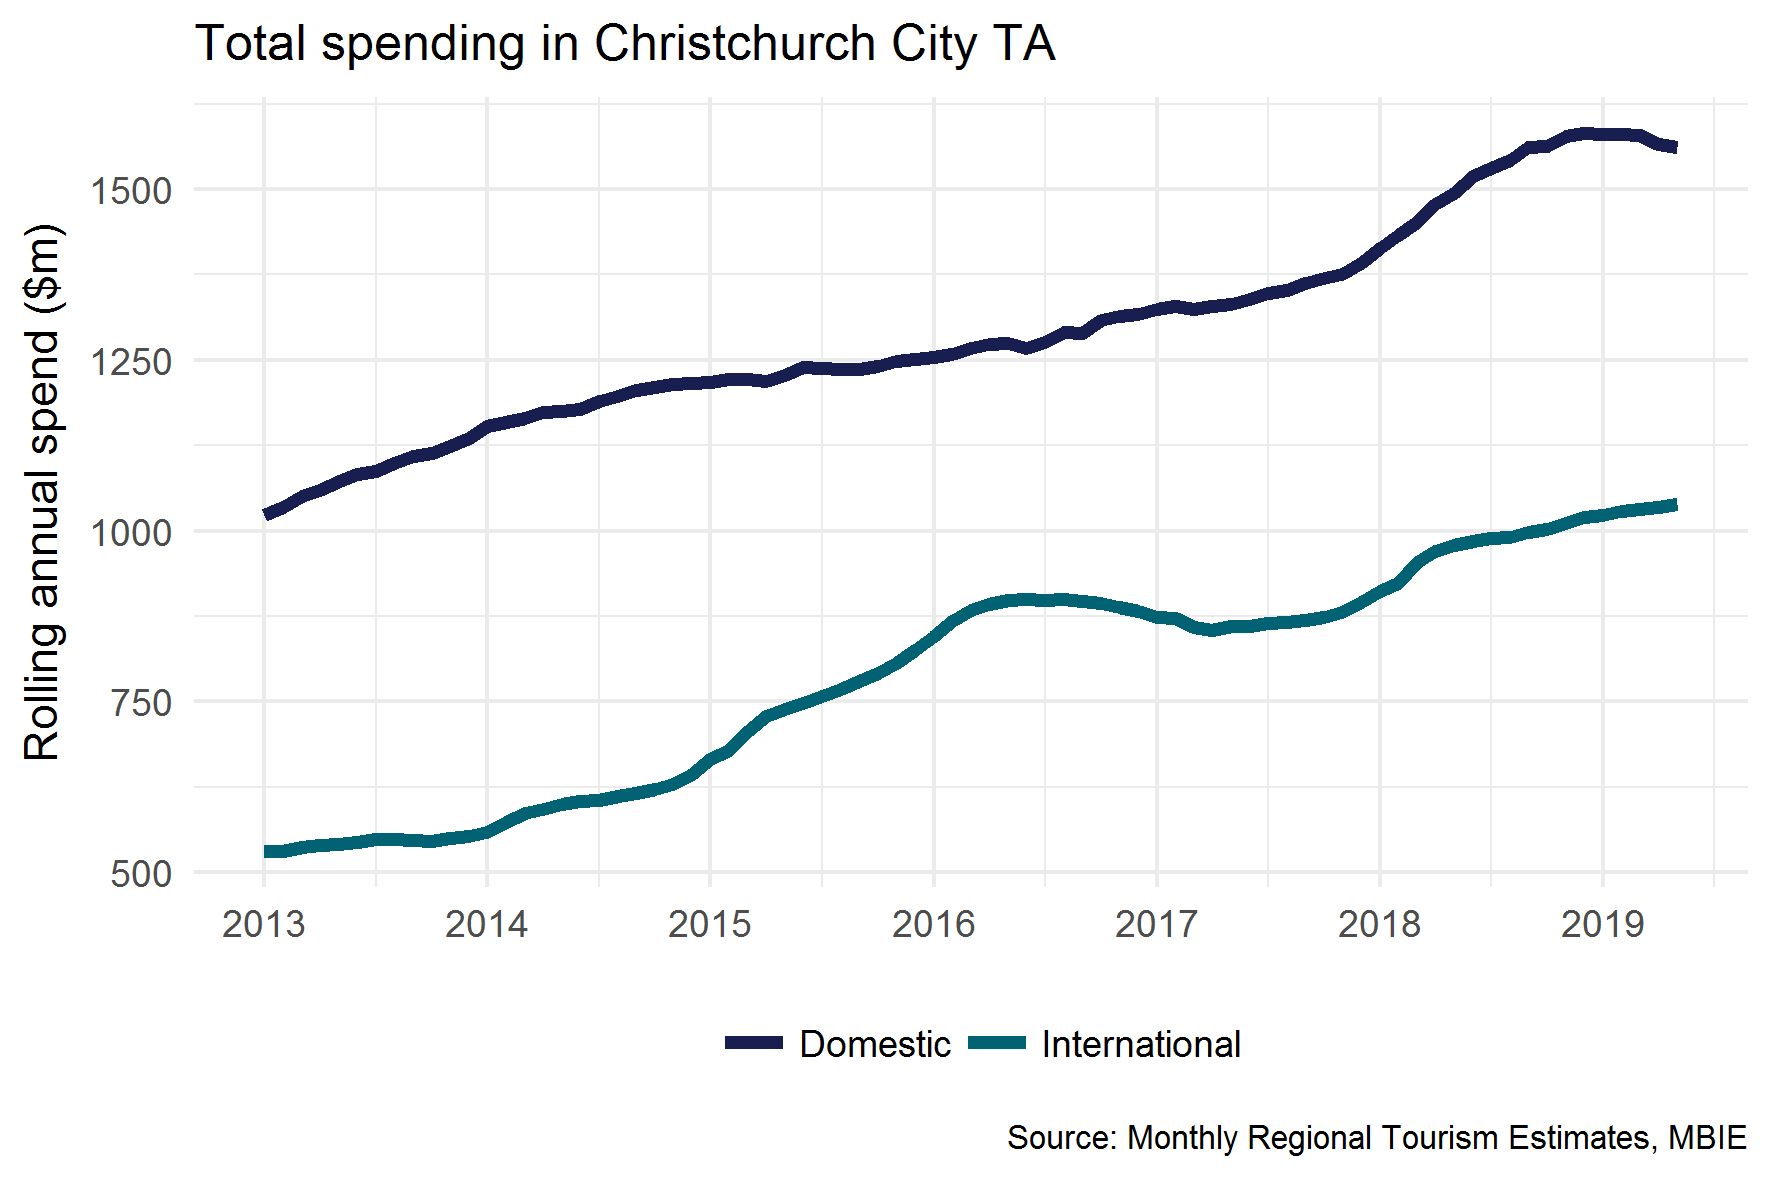
Although annual domestic spend in Christchurch has grown nearly five per cent in the year to April 2019 compared to the previous year, the growth has been decreasing since the start of the year. This appears to have been a trend since well before the attacks, with falls in domestic visitor spend seen in January through to April.
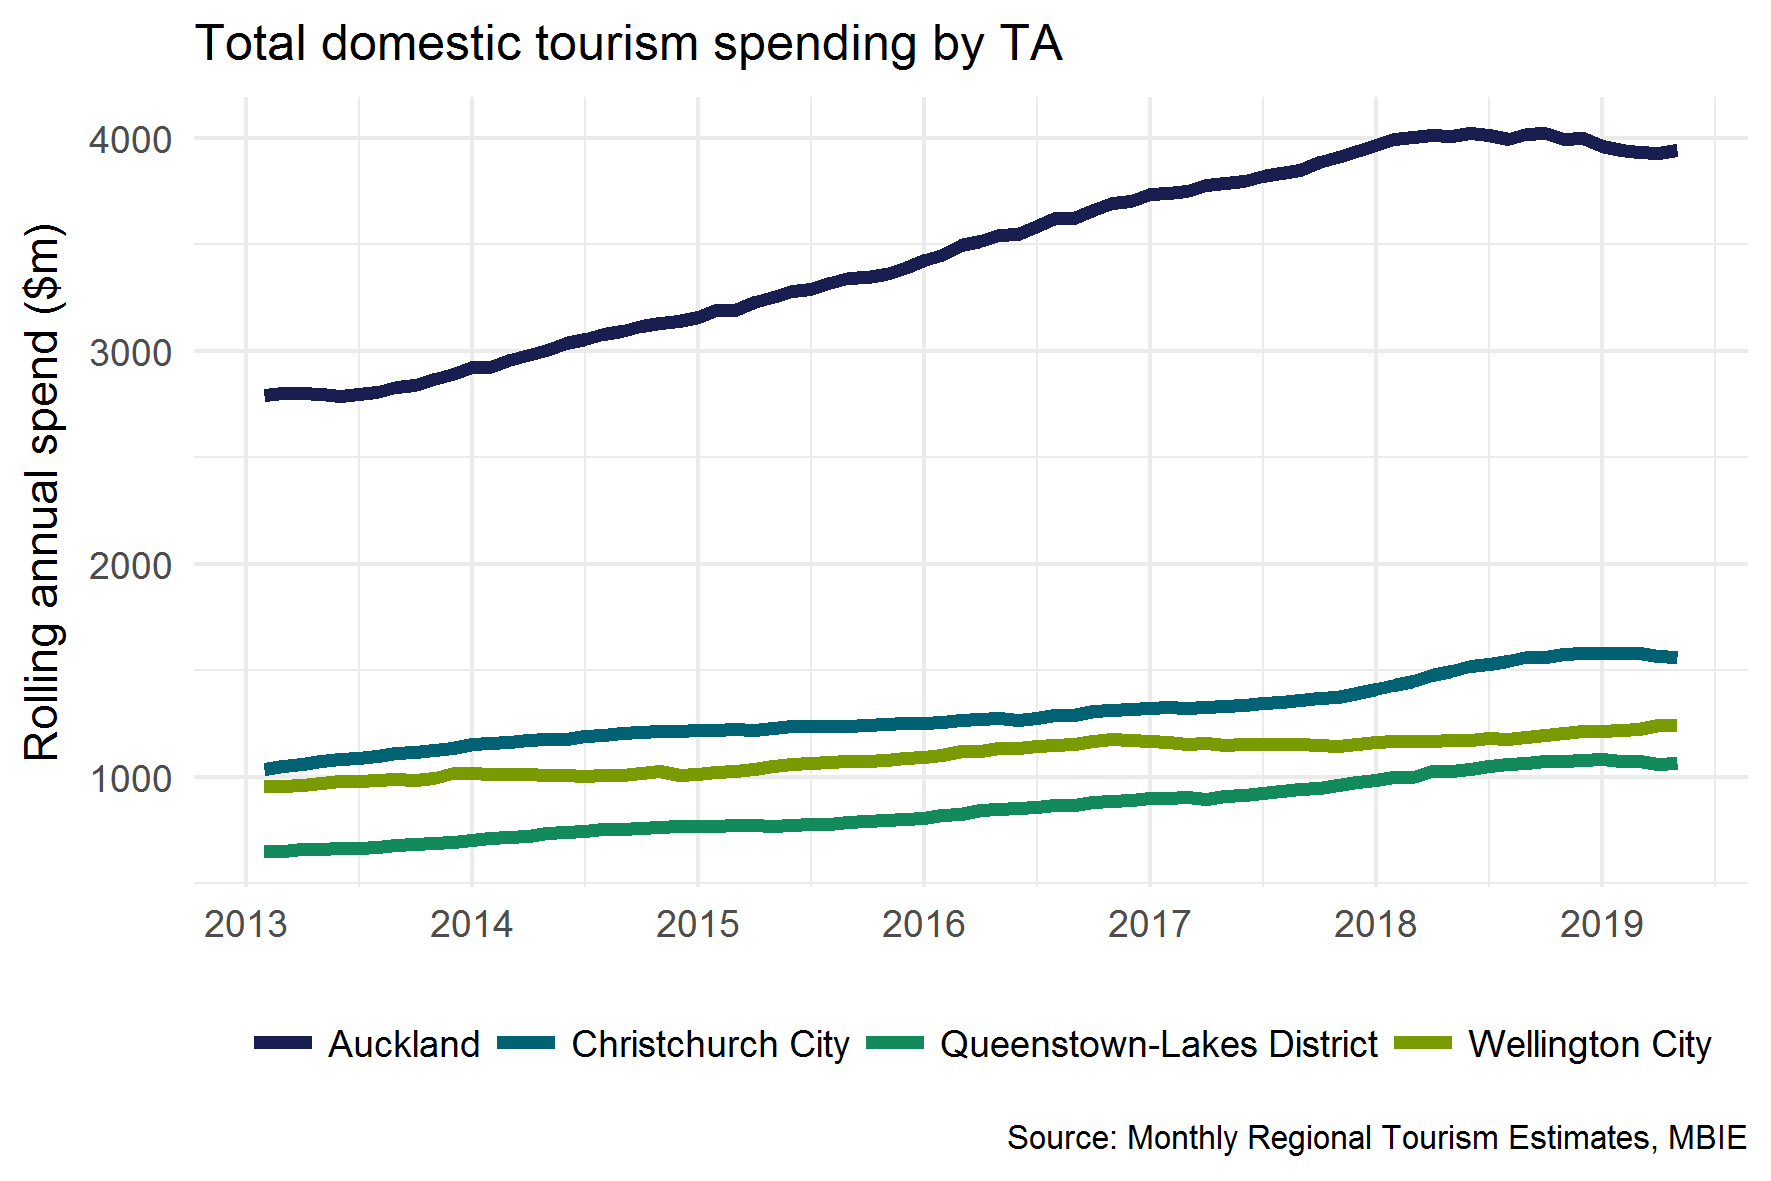
When comparing the domestic spend for the four gateway cities (cities that contain a major international airport), they seem to follow a similar pattern, with the exception of Wellington, which has continued to grow. It is important to note that, while domestic spend has fallen from the highs seen in 2018, it remains stronger than in the same period in 2017.
The MRTE Insights Viewer presents tourism spend data from the Monthly Regional Tourism Estimates in a map and shows key breakdowns by area. Data is available at Regional Council, RTO region, and Territorial Authority areas. Click here to start exploring the MRTE Insights Viewer.
The key findings for this section are listed below and expanded in the following sub-sections:
In 2018, Easter took place at the end of March, meaning that most people who travelled to New Zealand on their Easter holidays (most often Australians) were in March. For 2019 however, Easter was in mid-April. This was, in part, why overall quarterly visitor growth was lower than seen in the same period the previous year.
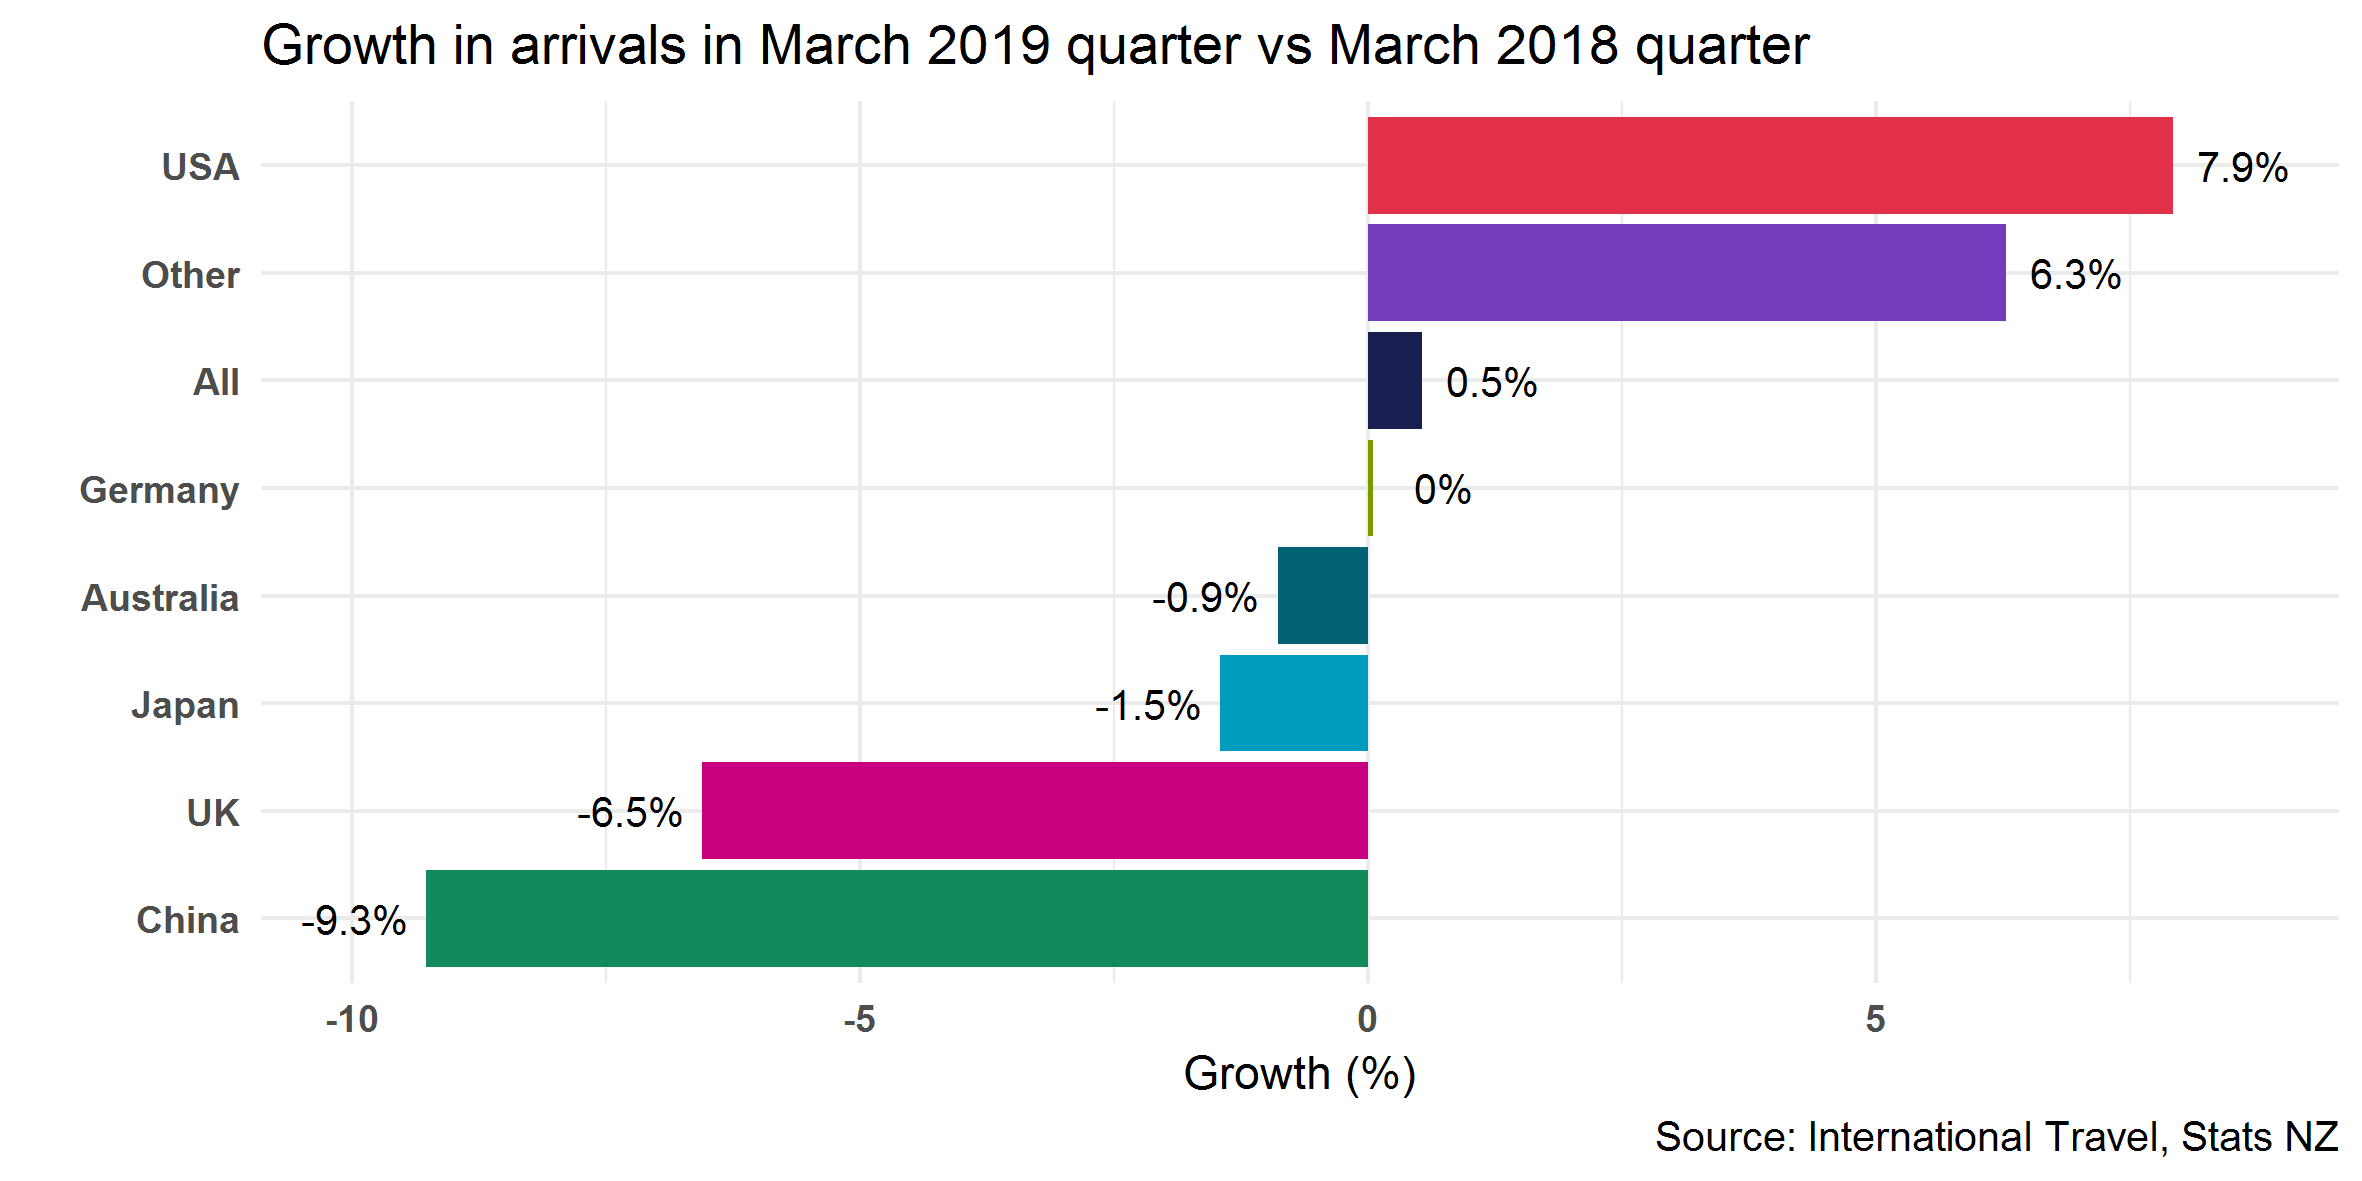
The first quarter of 2019 (January to March) saw a lot of media coverage around a slowdown in international arrival numbers to New Zealand, especially in the Chinese market. Chinese arrival numbers fell 9.3 per cent (13,900) when comparing the March 2019 quarter to the same one the previous year. Arrival numbers also fell in other large markets, with the UK down 6,900 (6.5 per cent) and Australia down 3,500 (0.9 per cent).
Chinese spending in the March 2019 quarter fell 7.4 per cent when compared with the same quarter in the previous year. This has been heavily affected by the 9.3 per cent fall in arrival numbers in the same period. In 2018, a third of all Chinese visitors to New Zealand arrived in the first quarter. The drop in Chinese arrival numbers and the resulting decrease in spend in the first quarter of this year, had a significant impact on annual spend figures overall.
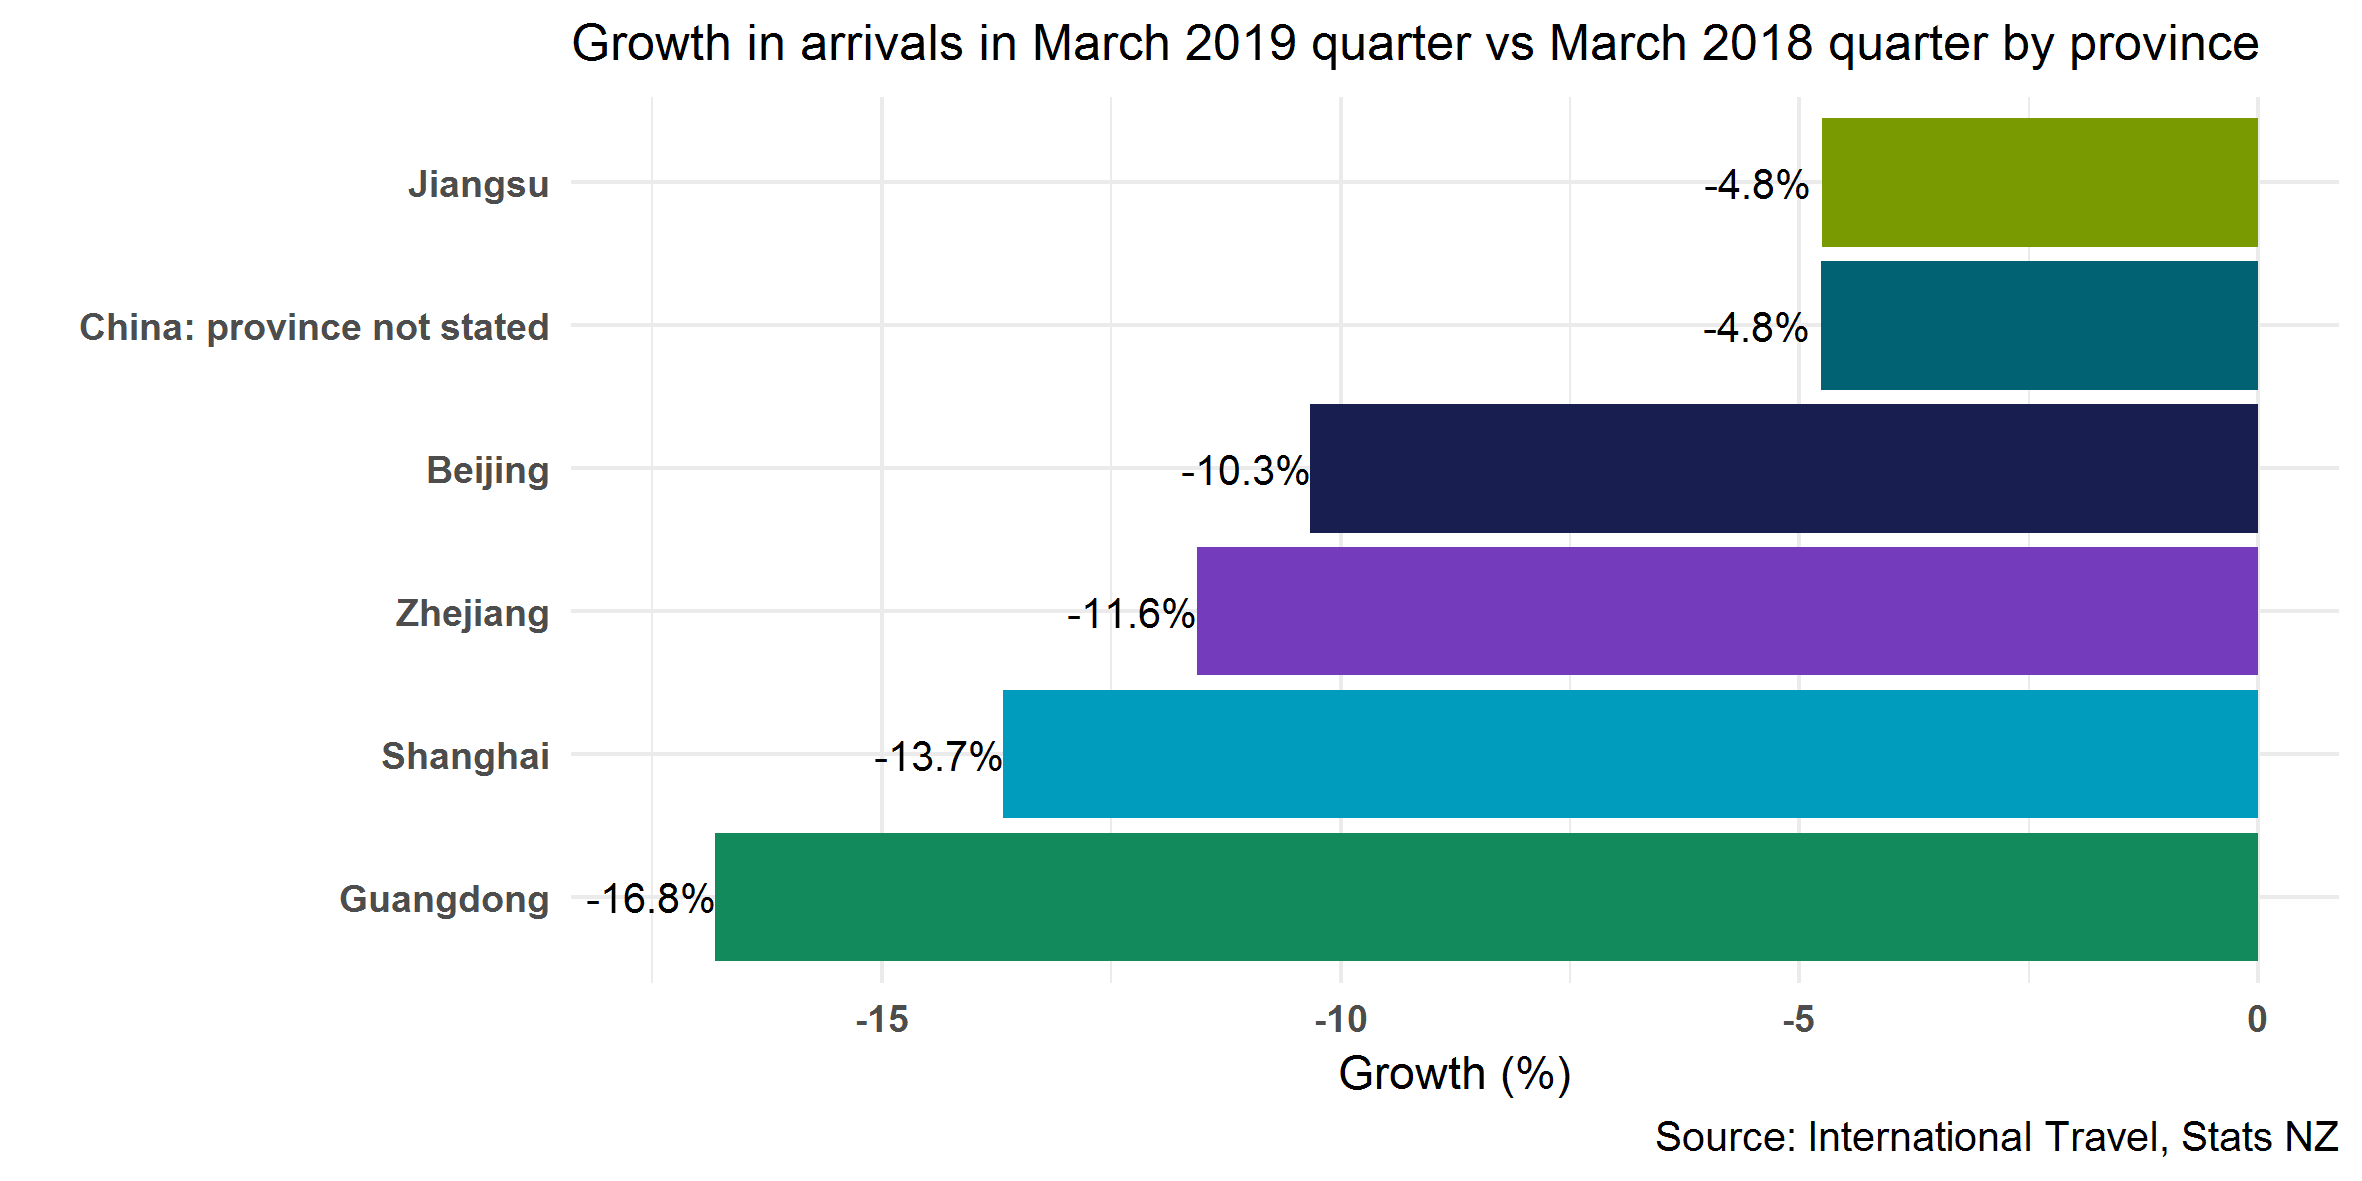
The Chinese provinces that have historically sourced the largest volumes of visitors showed the greatest fall in arrival numbers over the quarter. Guangdong, Shanghai, Zhejiang and Beijing all fell by over 10 per cent in March 2019 quarter, when compared with the same quarter the year before. This is compared with Jiangsu province where arrival numbers only fell by 4.8 per cent on average.
Please note the IVS uses departure numbers in its methodology so arrival numbers may differ within smaller periods. Also note that many other provinces in China are not included in the travel statistics.
Over the year ended March 2019, the story appears similar. Arrival numbers from Beijing fell 7.6 per cent, Shanghai 3.7 per cent and Guangdong 3.6 per cent. However, Chinese arrival numbers from Zhejiang and Jiangsu were relatively flat.
The QTR covers the performance of the tourism sector over the last year. The report draws on data from a range of sources, including:
The International Visitor Survey (IVS) was developed to provide accurate, quarterly, national information on the expenditure of international visitors to New Zealand, as well as their behaviours and characteristics. In particular, the main purpose of the IVS is to measure the total annual expenditure by international visitors in New Zealand. In addition, the IVS:
The Monthly Regional Tourism Estimates (MRTEs) provides estimates of regional tourism spend for international and domestic travellers, broken down by country of origin and tourism product. The estimates are developed using:
International Travel and Migration Statistics are produced by Stats NZ from arrival and departure card information. This data provides the number of overseas visitors, New Zealand resident travellers, and permanent and long-term migrants entering or leaving New Zealand.
The Accommodation Survey is run by Stats NZ by surveying all economically significant hotels, motels, holiday parks and backpackers in New Zealand. The survey provides information about short-term commercial accommodation activity at national, regional, and lower levels. Statistics include guest night numbers, capacity, and occupancy rates.
Immigration New Zealand provides data for people arriving in New Zealand on visas.