Logo MBIE Logo DOC

Resources

Credit: Unsplash

Calculating year-ended figures in the MRTEs

June 18, 2019

This article was produced by the Ministry of Business, Innovation and Employment (MBIE). The content you find below is exclusive to the Tourism Evidence and Insights Centre.

MRTE data overwrites historical data every month

Monthly Regional Tourism Estimates (MRTE) data is uploaded to the MBIE website every month. Due to the way the database is structured, year-end data is given only for the latest month. This document instructs users how to calculate MRTE year-end for any historic month, from the available data.

The current data download section contains all data back to 2008

The data download section of the MRTEs website contains nine excel spreadsheets. These spreadsheets include all monthly level data back to April 2008 and can be broken down by region, Regional Tourism Organisations (RTO), country, domestic origin and product type. Territorial Authority (TA) level data can only be found at the annual level.

The first spreadsheet provides a summary of the latest month/year-ended figures. The following four spreadsheets provide regional level data and the remaining four provide RTO level data. Below you have links to each one of these files:

Year-end figures can be calculated for any month using the available data

Using the data supplied in the data download section, we can calculate any monthly or year-end spend figures. Year-end spend figures for the current month can be found in the annual spreadsheets above. These files only contain year-end figures for one month as, due to accuracy and confidentiality reasons, we only release TA level data at the annual level.

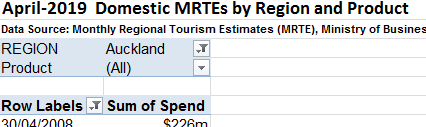
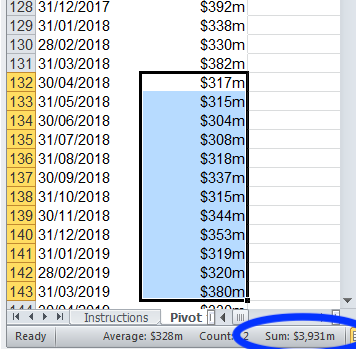
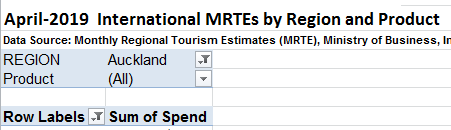
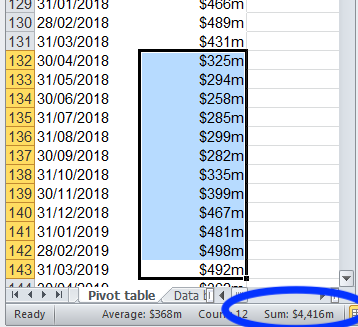
We can calculate year-end figures for all other months by following the five steps below. For example, if we want to calculate the year-ended March 2019 spend figure for the Auckland region, we would:

  1. Open up the domestic product by region spreadsheet, go to the pivot table and select Auckland from the list of regions;
    Step 1 - Pivot table Domestic product by region
    Figure 1 - This figure shows the pivot table Domestic product by region downloadable from MBIE's website. Source: Monthly Regional Tourism Estimates, from MBIE.
  2. Select the months within the year-ended March 2019 (April 2018 – March 2019). Sum these together (tip, highlight the cells you want to sum and a sum figure will appear in the bottom right hand corner of the spreadsheet);
    Step 2 - selecting months of interest
    Figure 2 - This figure shows how to select the months of interest to calculate year-ending figures from pivot tables with domestic data from the Monthly Regional Tourism Estimates. Source: Monthly Regional Tourism Estimates, from MBIE.
  3. Open up the International product by region (international country by region) spreadsheet, go to the pivot table and select Auckland from the list of regions;
    Step 3 - pivot table for international products
    Figure 3 - This figure shows the pivot table International product by region downloadable from MBIE's website. Source: Monthly Regional Tourism Estimates, from MBIE.
  4. Select the months within the year-ended March 2019 (April 2018 – March 2019). Sum these together (tip, highlight the cells you want to sum and a sum figure will appear in the bottom right hand corner of the spreadsheet);
    Step 4 - repeating calculation for international product
    Figure 4 - This figure shows how to select the months of interest to calculate year-ending figures from pivot tables with international data from the Monthly Regional Tourism Estimates. Source: Monthly Regional Tourism Estimates, from MBIE.
  5. Sum together the domestic and international spend figure to get the overall spend figure for the year-ended March 2019 - $3,931m + $4,416m = $8,347m ($8.347b).


This method can be applied to any combination of variables e.g. for accommodation spend totals, the product selection at the top will have to be changed to ‘accommodation’.

To find growth in spend from one year to the next, we compare the year-end spend figure, and the same spend figure for the year before.