
Credit: Raphael Aggio
This article was produced by the Ministry of Business, Innovation and Employment (MBIE). The content you find below is exclusive to the Tourism Evidence and Insights Centre.
Welcome to MBIE’s first Quarterly Tourism Report. This is an experimental report intended to provide useful insight to the tourism industry and wider government on the state of play in the tourism sector in New Zealand, using existing available data sources and knowledge of the industry. We are looking to tailor these reports to be as useful to business and government as possible, to allow better use of data in strategic decision making.
We are very interested in any feedback, or suggestions on content, that we can provide for future releases. Please get in touch with us through the email TR_SharedMailbox@mbie.govt.nz.
The Tourism Data Domain Plan (TDDP) sets out the main priorities for improving tourism statistics, based on agreement by industry and government stakeholders. The QTR fills some gaps identified in the TDDP. In particular, the QTR aims to improve data usability and capability within the sector. The QTR assists in the following specific initiatives:
The commentary below presents the national context for tourism in the year ending September 2018 (and for the September 2018 quarter where available). The main tourism measures are showing relatively stable growth across the New Zealand tourism industry, supported by the continued increase in holidaymakers, and favourable exchange rates. Key findings are below:
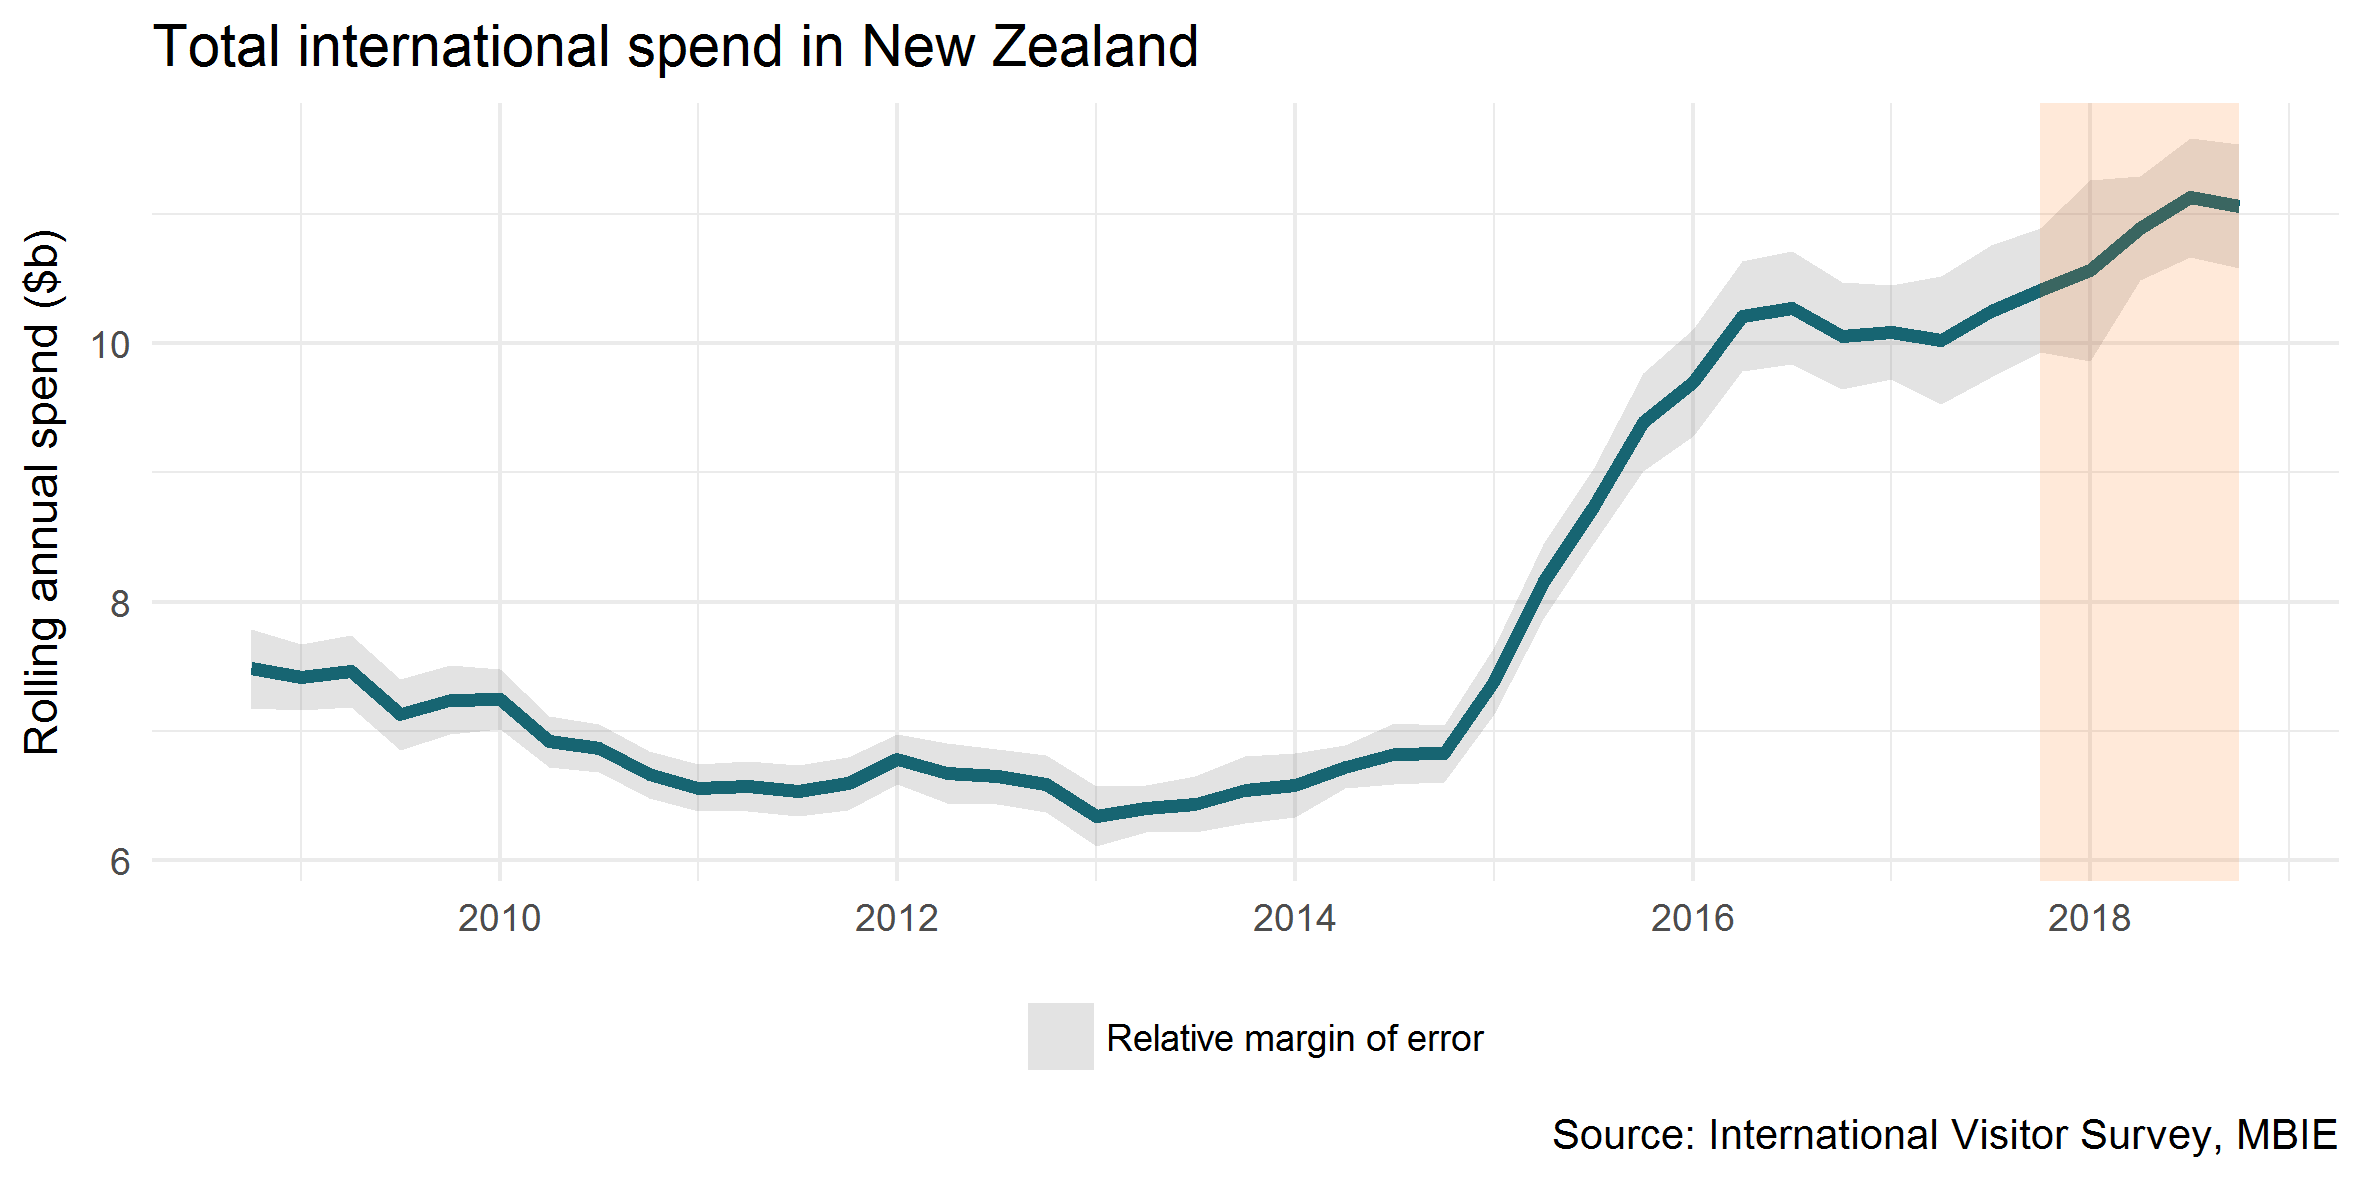
Spending by international visitors in New Zealand grew six per cent to $11.1 billion for the year ending September 2018. This equated to an overall increase of $650 million over the year (although the growth was not statistically significant).
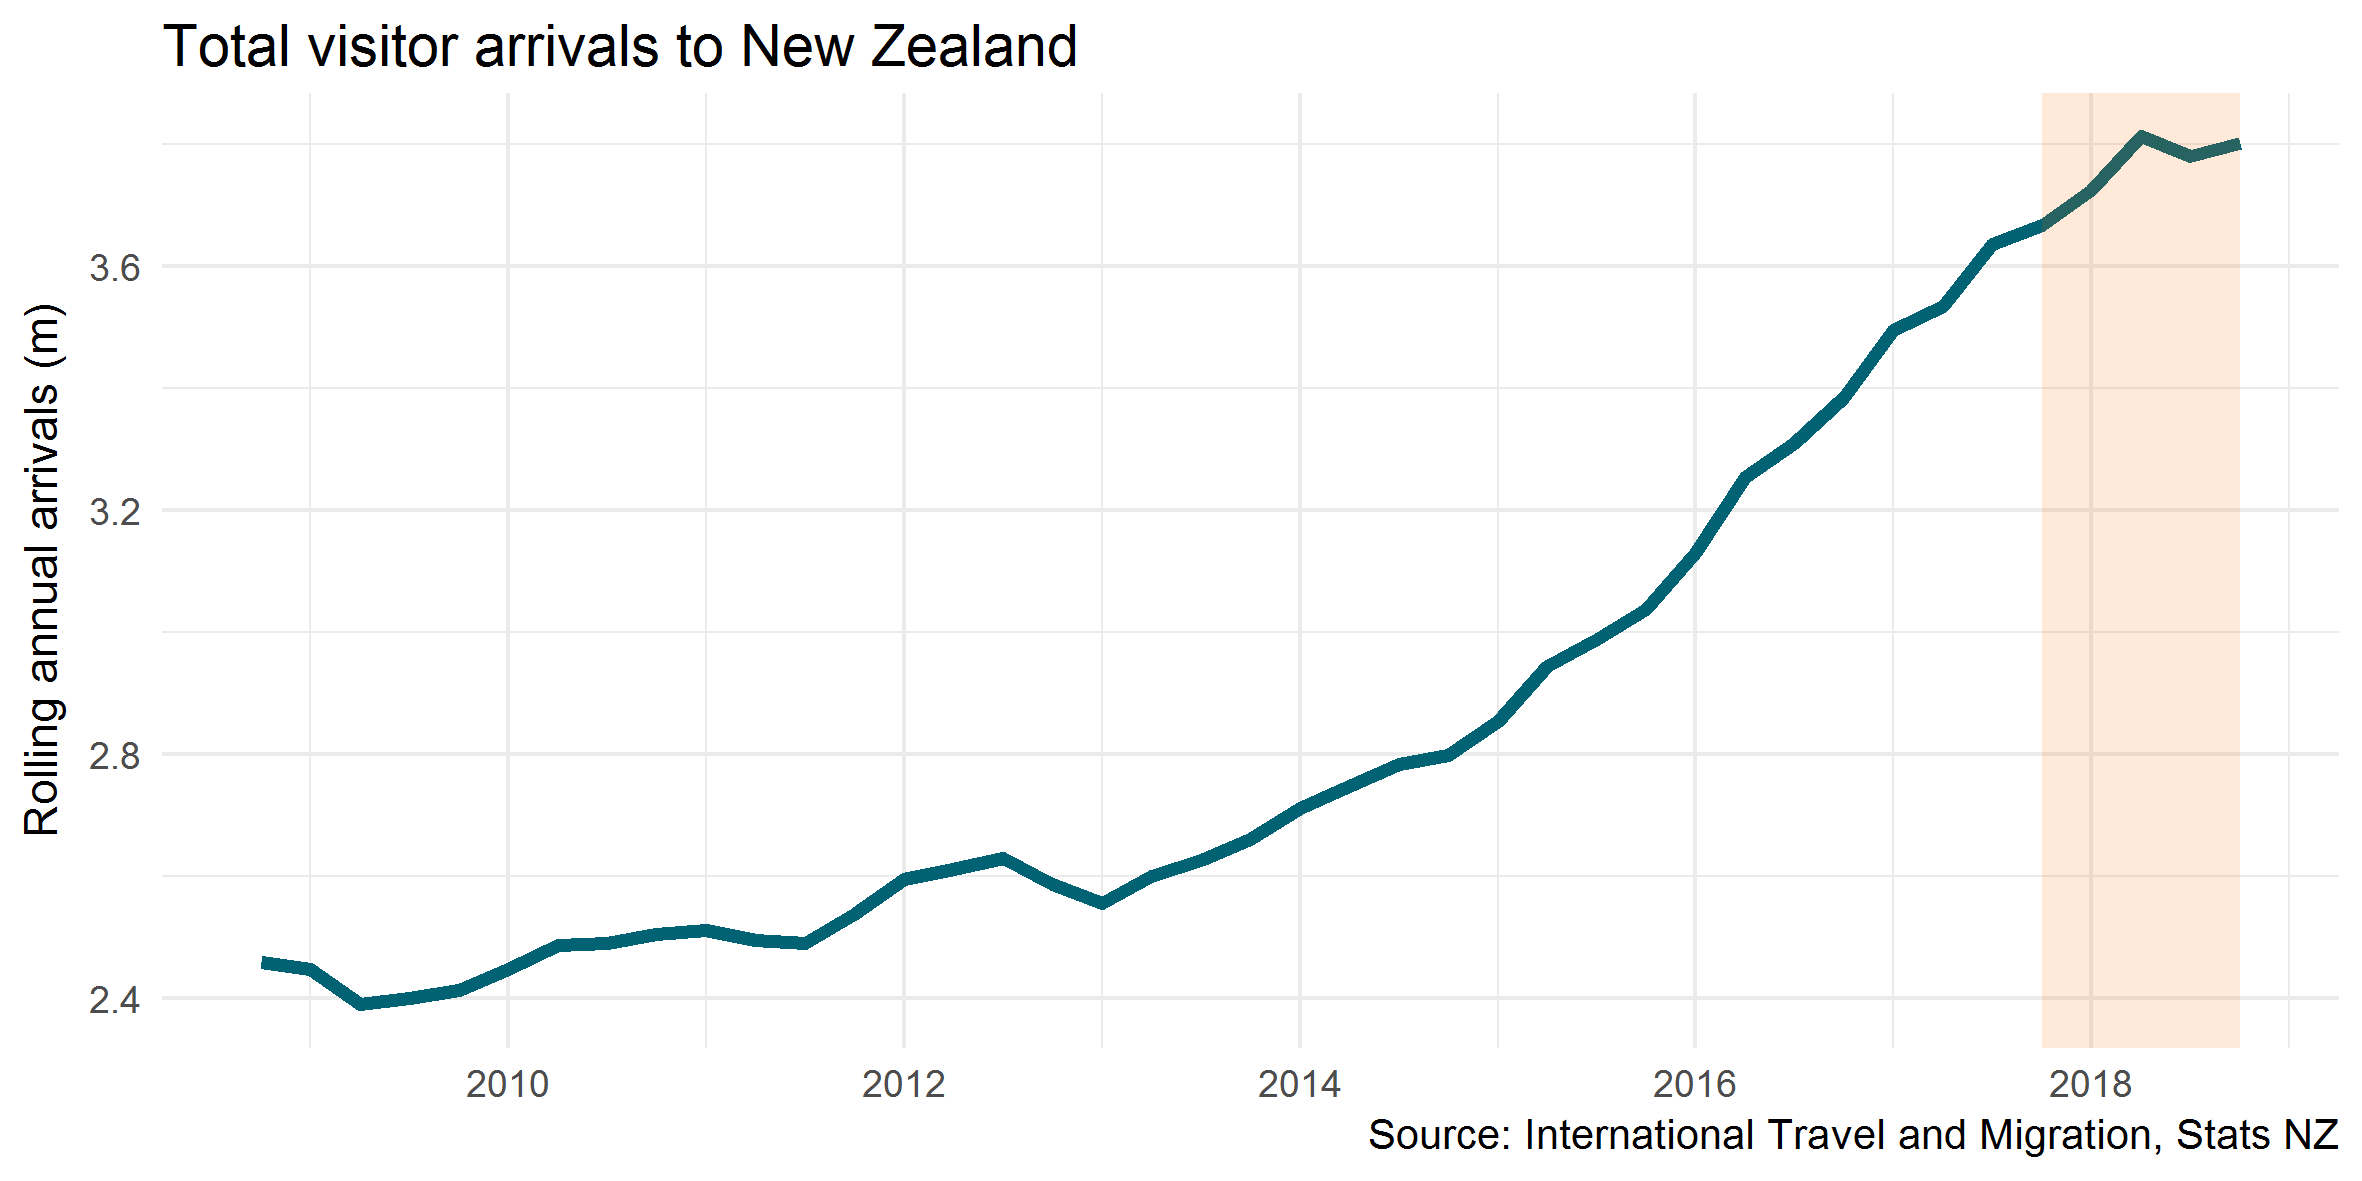
Over the same period, the number of international visitors increased by four per cent. Spend, however, grew faster than visitor numbers, leading to an increase of three per cent for average spend per visitor. Average international visitor spend over the year was $3,300 per visitor.
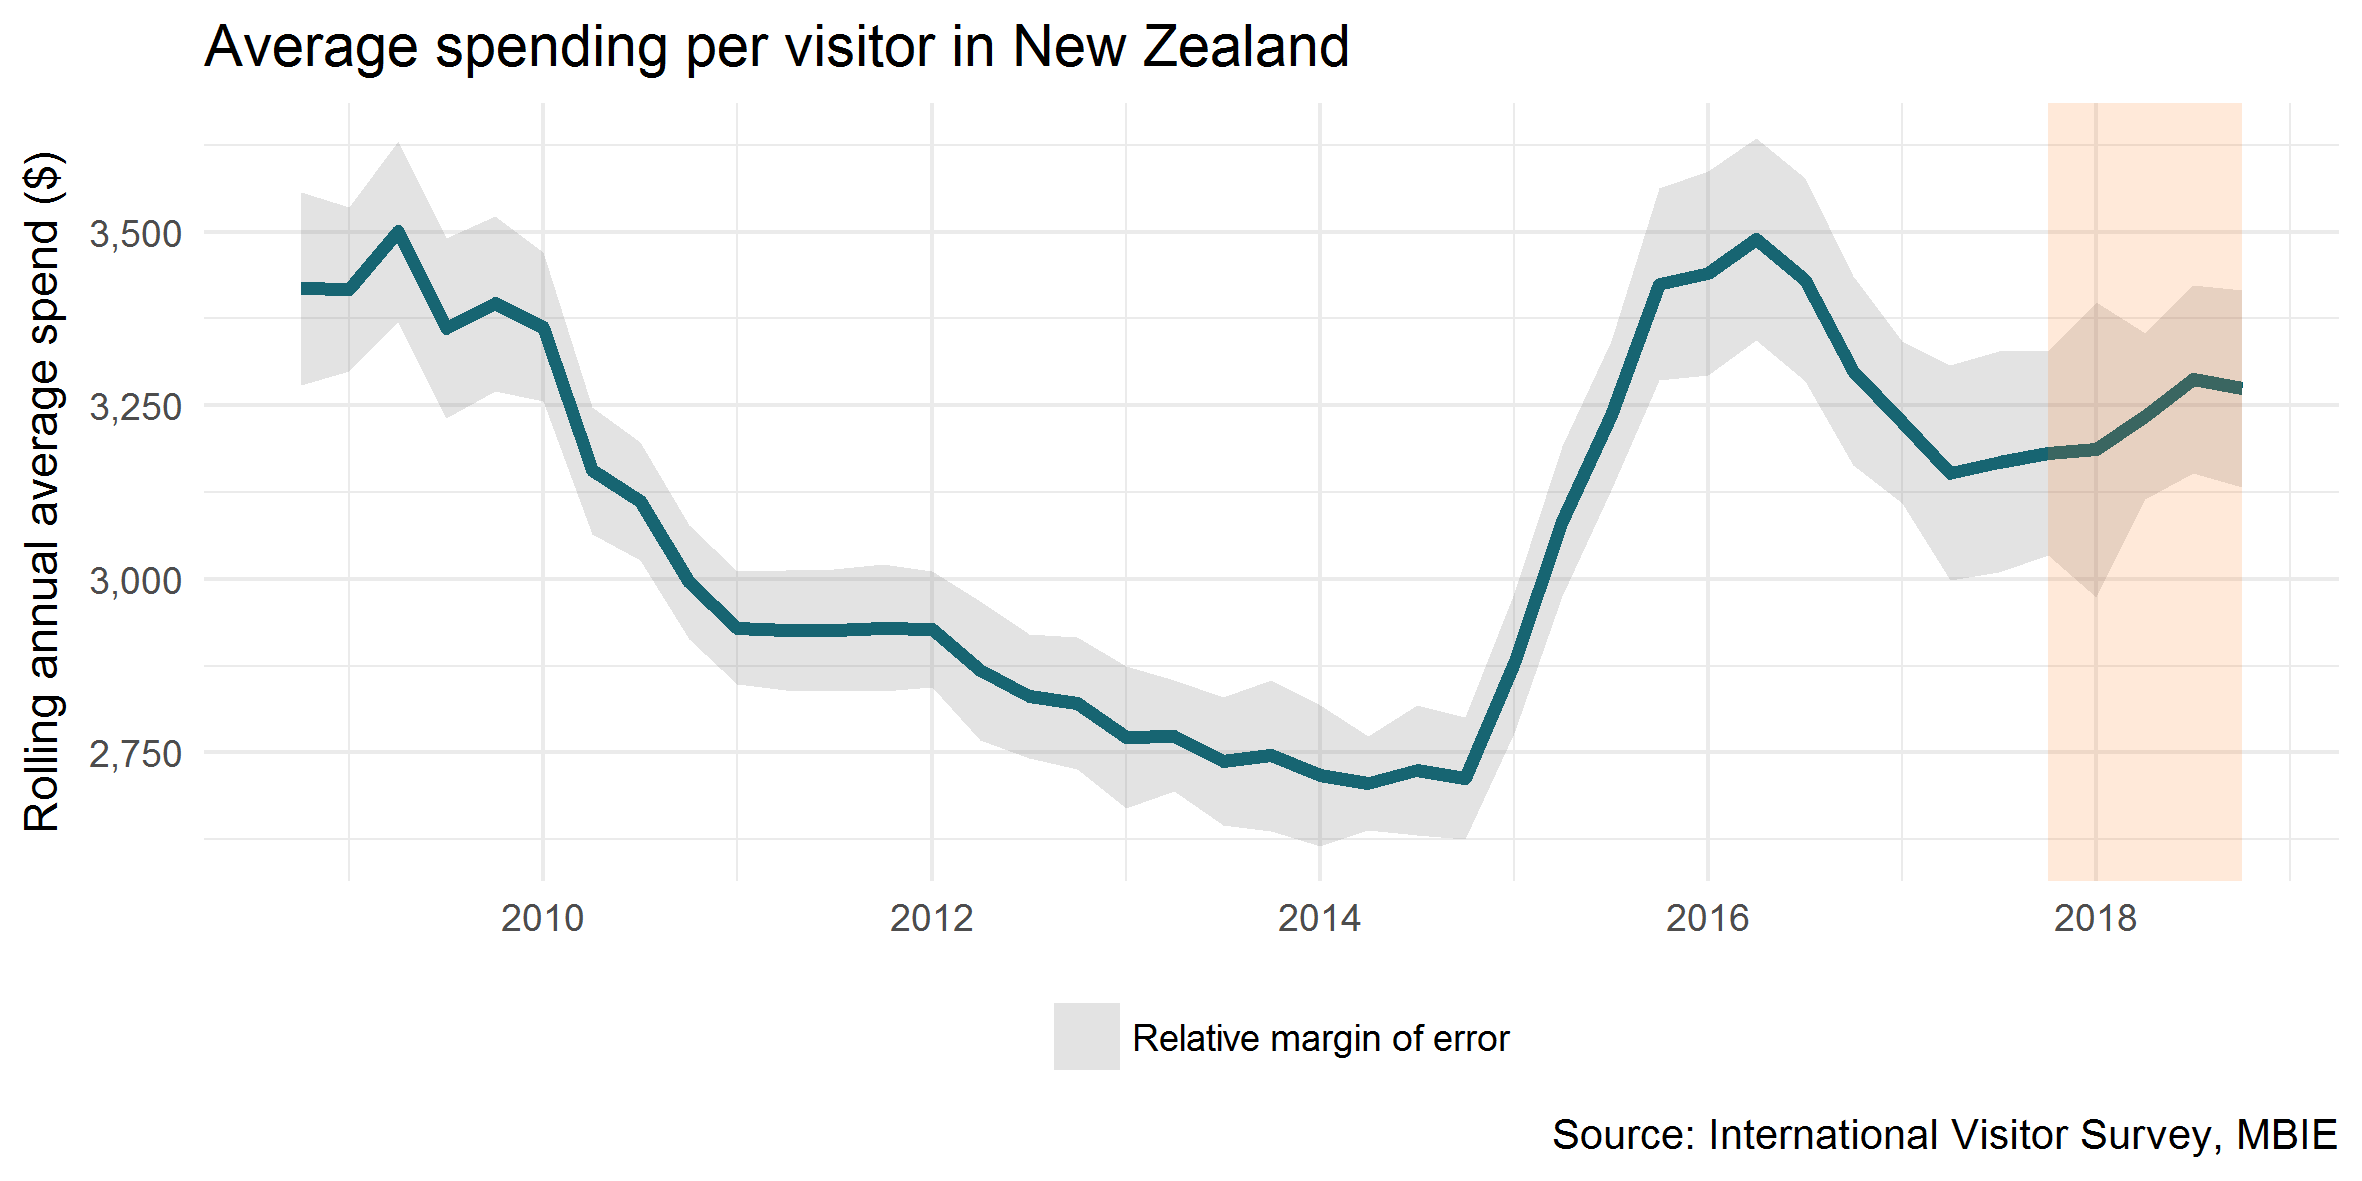
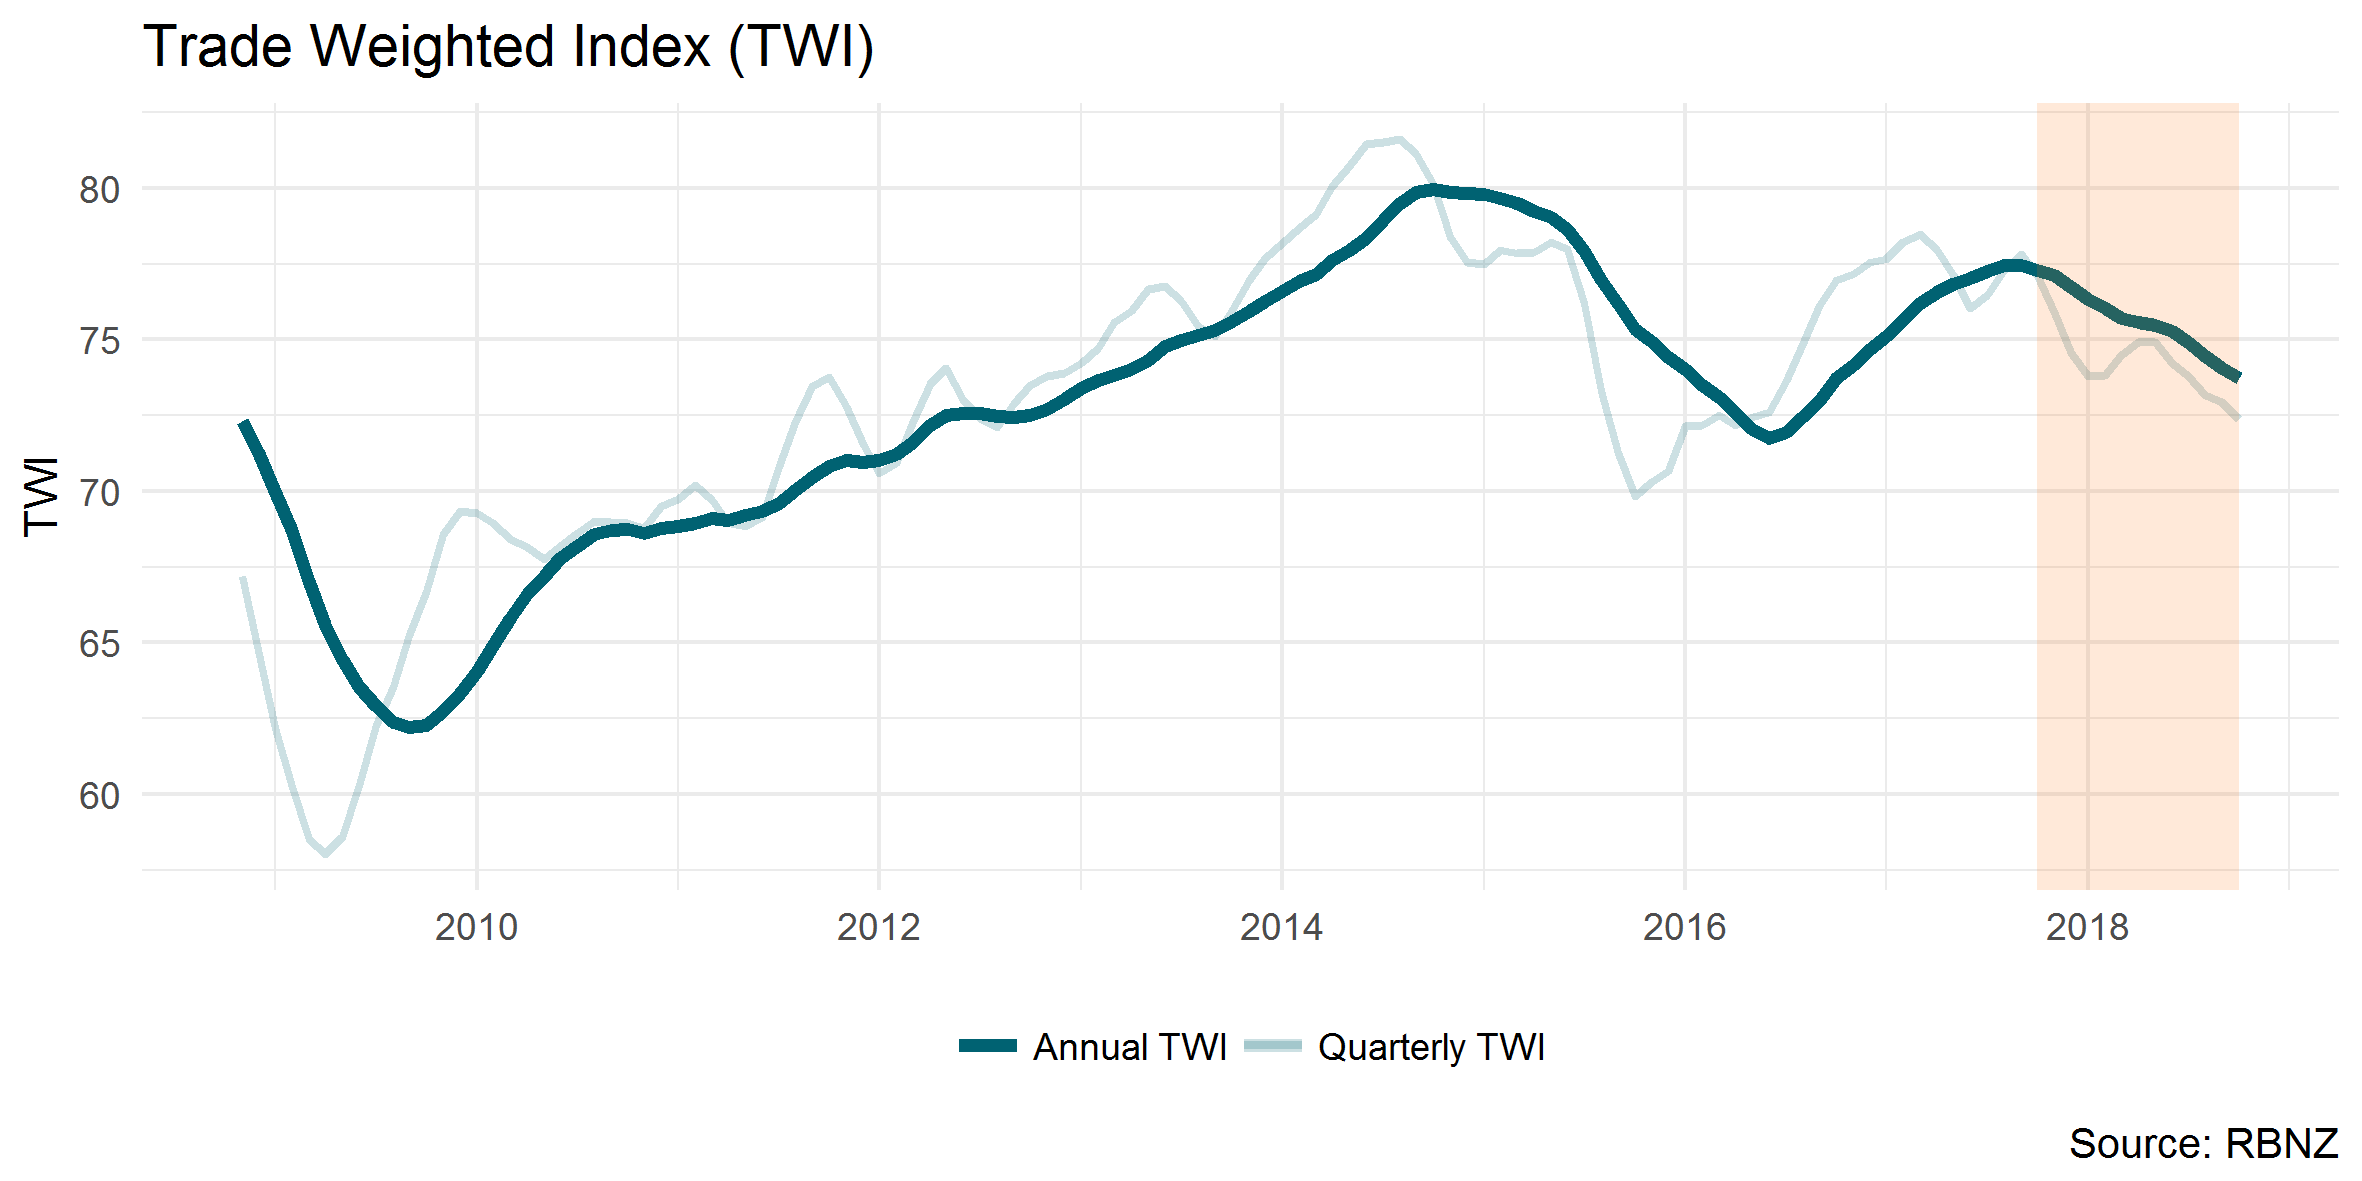
So what caused international visitor spend to increase faster than visitor numbers? One reason might be the fall in the New Zealand dollar against many of our major tourism markets over the year. This fall increased the purchasing power of visitors, allowing them to spend more in New Zealand dollars for the same amount of their home currency.
The following graph shows that the Trade Weighted Index (TWI) fell six per cent for the year ended September 2018. The TWI is an index showing the value of the New Zealand dollar in relation to our major trading partners.
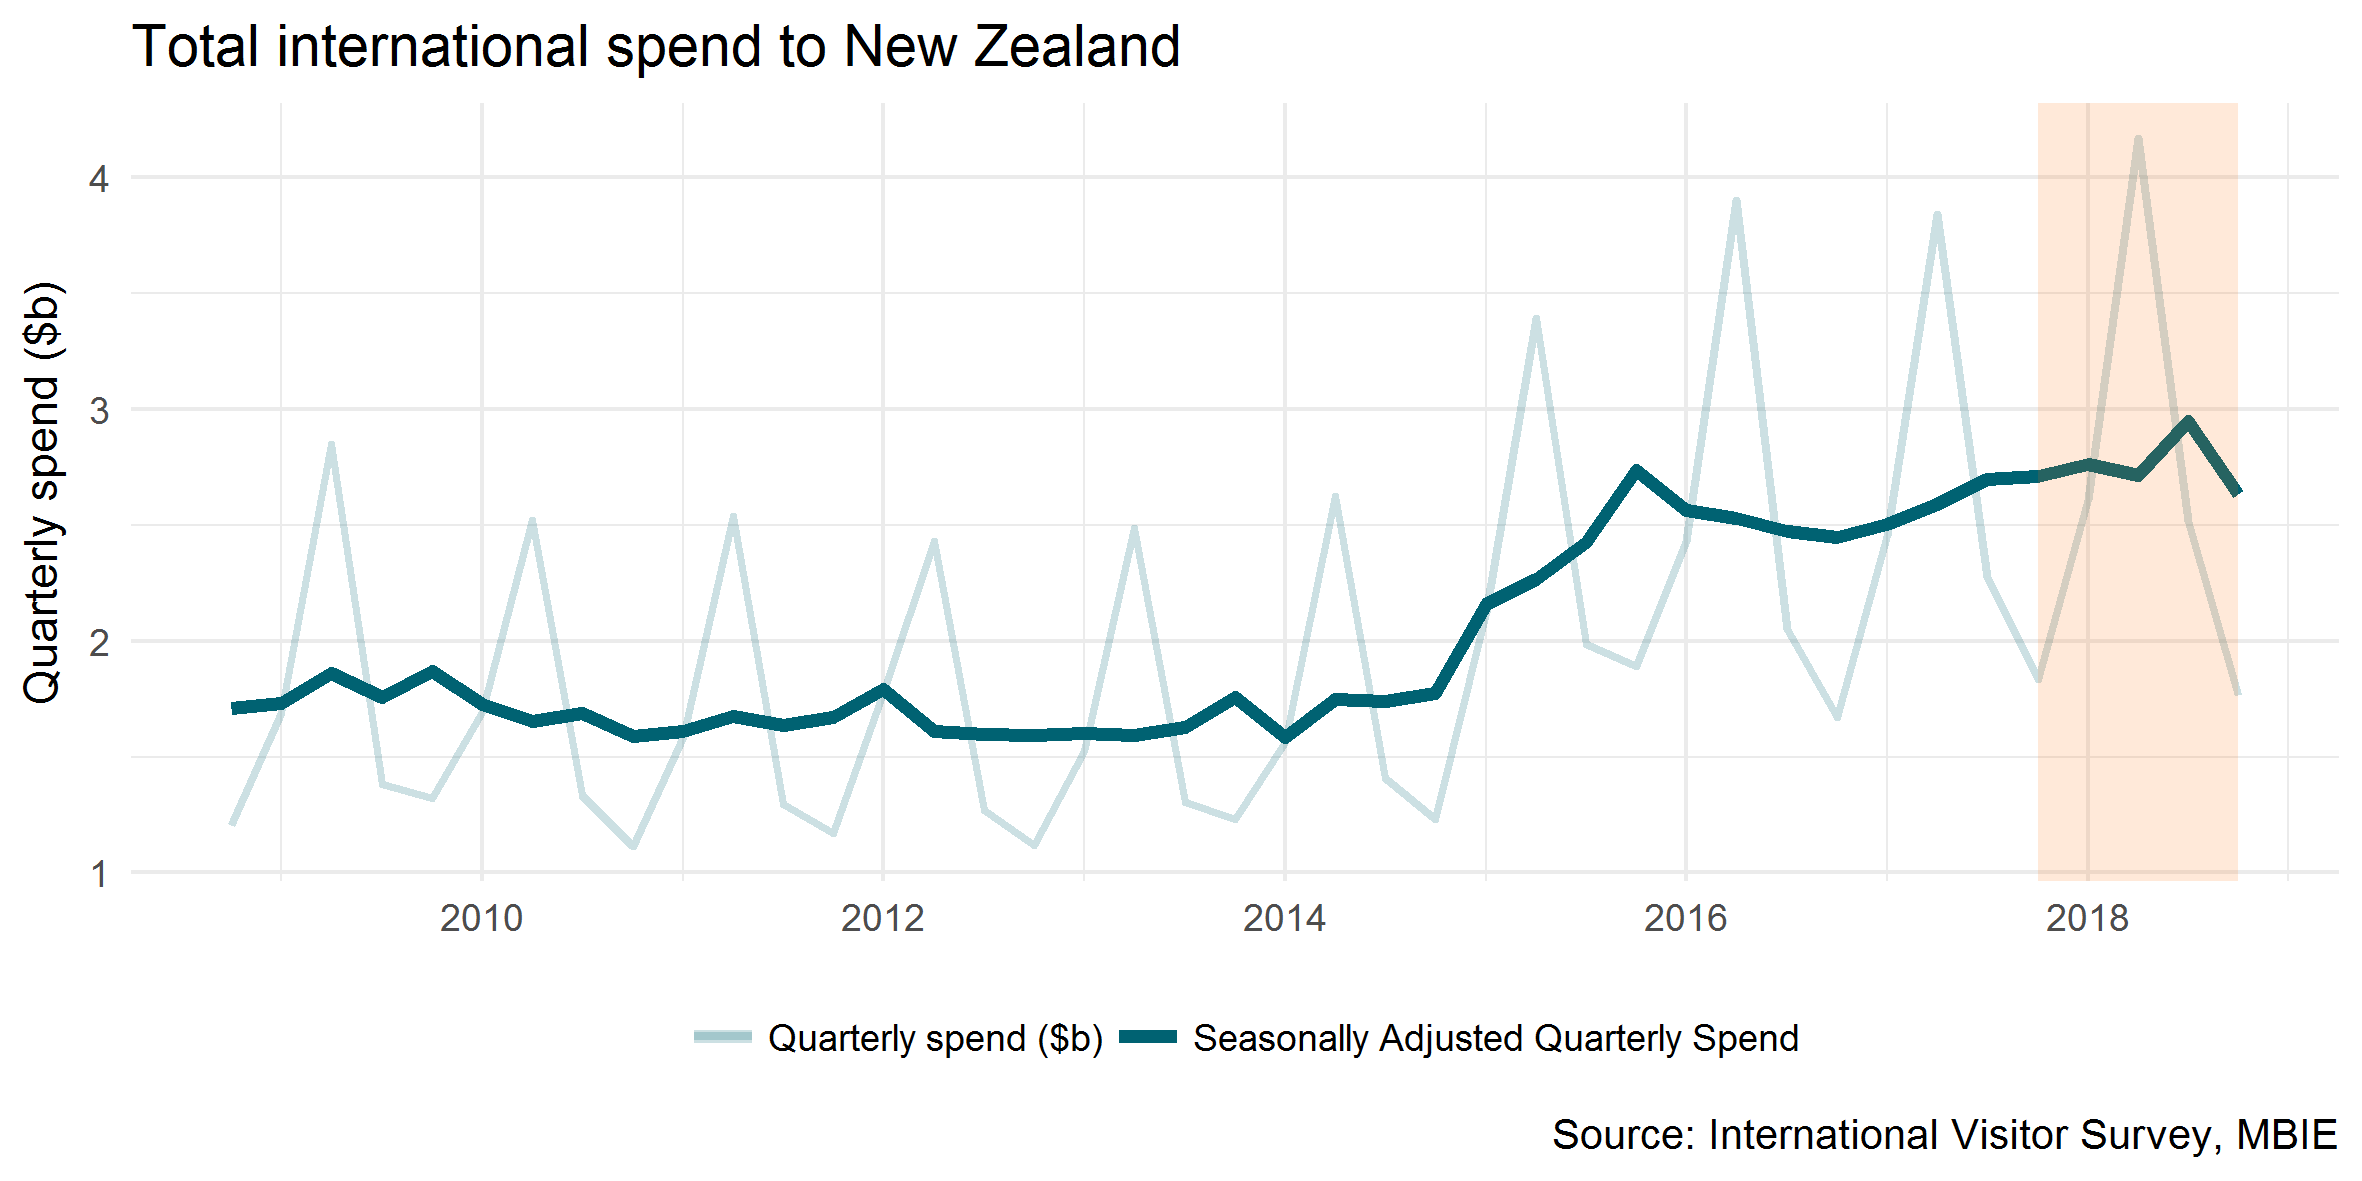
After adjusting for seasonal impacts, there was a fall in total international visitor spending of around 11 per cent for the September 2018 quarter, down from the high seen in the June 2018 quarter. This drop shows that spend in the September quarter was lower than might have been expected given usual seasonal patterns.
From the year ended September 2017 to the year ended September 2018, the number of visitors to New Zealand grew by 135,000. Of these visitors, three fifths (or 83,000) were holidaymakers, while almost a quarter (or 32,000) were visiting friends or relatives.
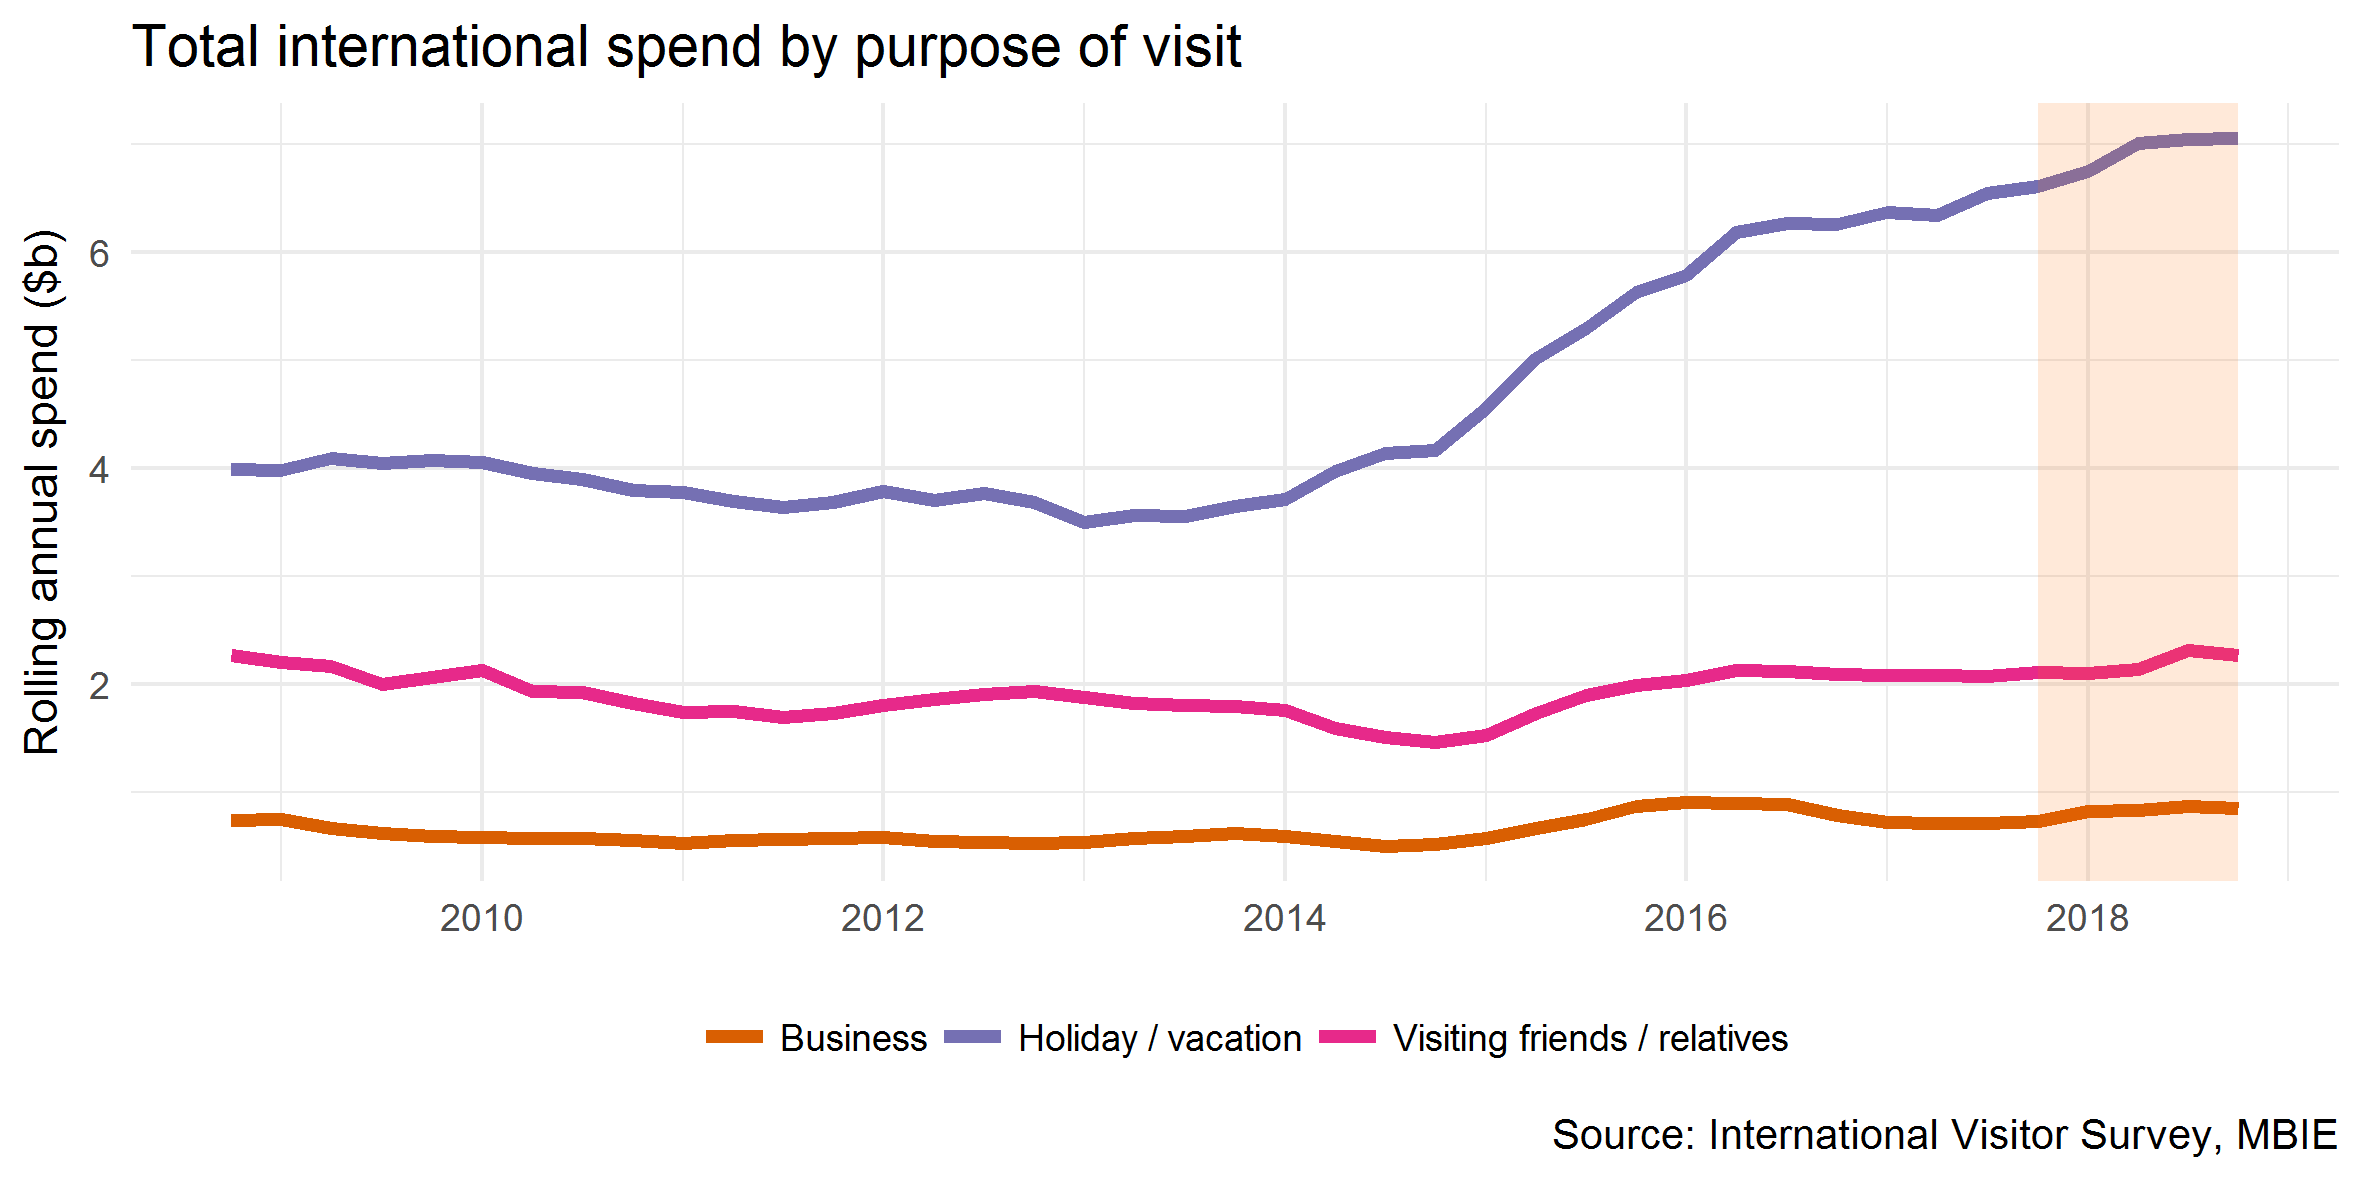
Holidaymakers to New Zealand made up around 53 per cent of all international arrivals in the year ended September 2018, yet made up approximately 64 per cent of all spending. In contrast, people visiting friends and relatives made up 29 per cent of all arrivals, yet made up just 20 per cent of all spend.
Holidaymakers spent on average $3,900 per person in the year ended September 2018, while people visiting friends and relatives spent on average $2,400. Thus, we can see a notable gulf between visitor markets. People visiting friends and relatives tend to spend less when they visit, especially on accommodation, as they often have friends or family to stay with. They also tend to stay for shorter periods and are more likely to be Australians.
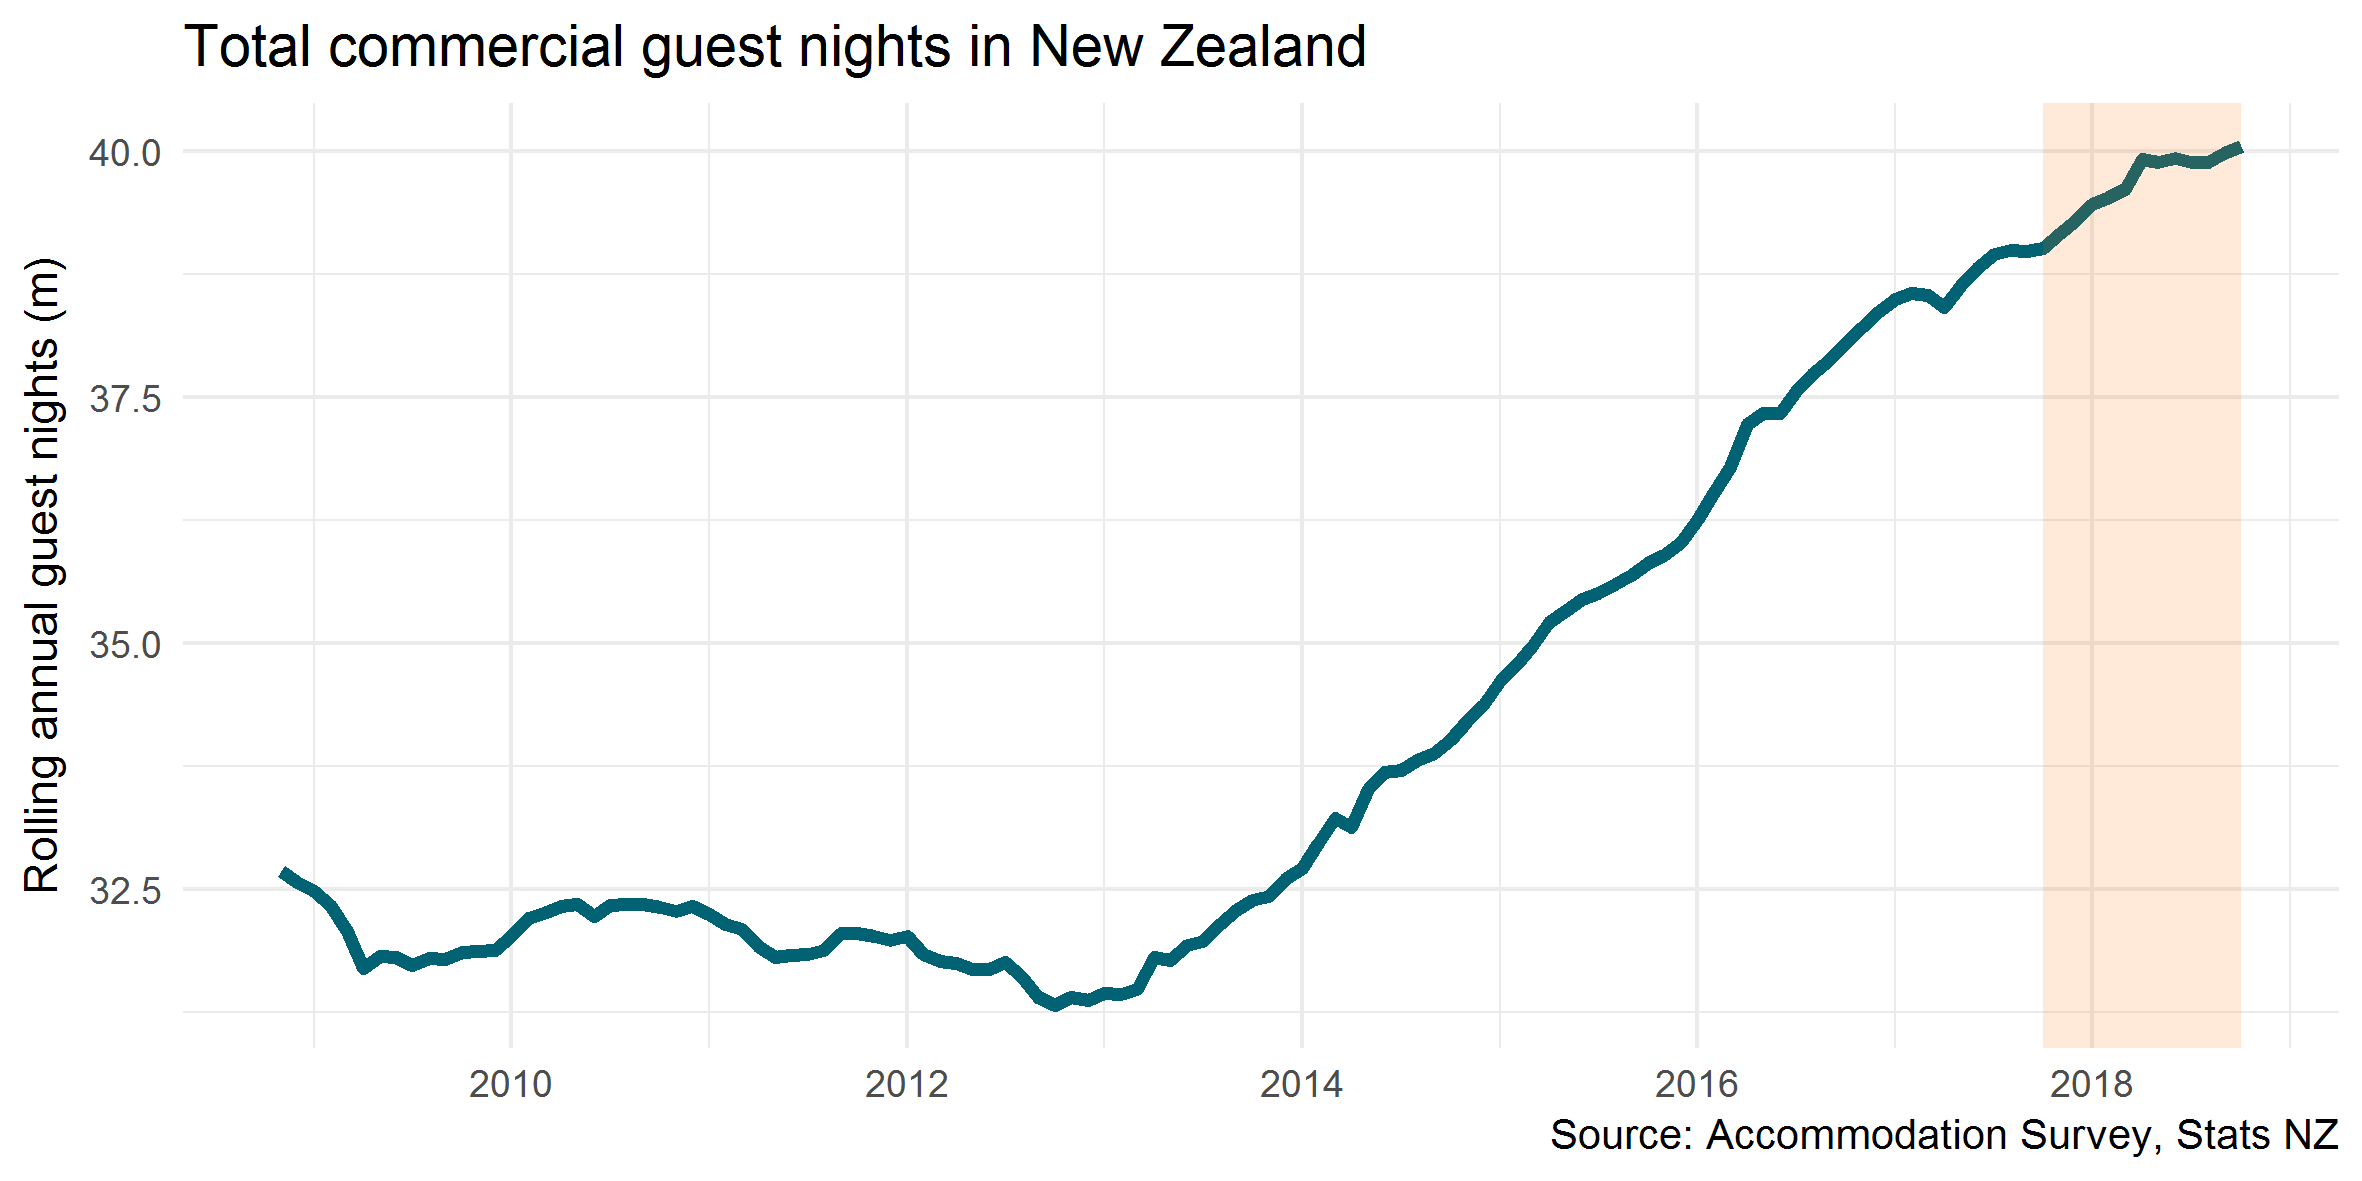
There were 40.1 million guest nights in measured commercial accommodation (hotels, motels, backpackers and holiday parks) in the year ended September 2018, up three per cent (or one million) from the previous year. This figure includes both domestic and international visitors. Domestic visitors make up approximately 60 per cent of all guest nights.
Please note that this measure is partial, and does not include guest nights in hosted accommodation, such as homes rented through a peer-to-peer network such as Airbnb. It also does not include guest nights in holiday homes or people staying with friends and family. However, it does provide useful data about what is happening in the sector.
Looking back over the last year, most growth in commercial guest nights occurred in March (where guest nights increased 310,000) and October, November and December (up 143,000, 141,000 and 159,000, respectively). The strong demand for accommodation in the peak months of January and February may be a motivation for visitors to travel earlier or later in the year.
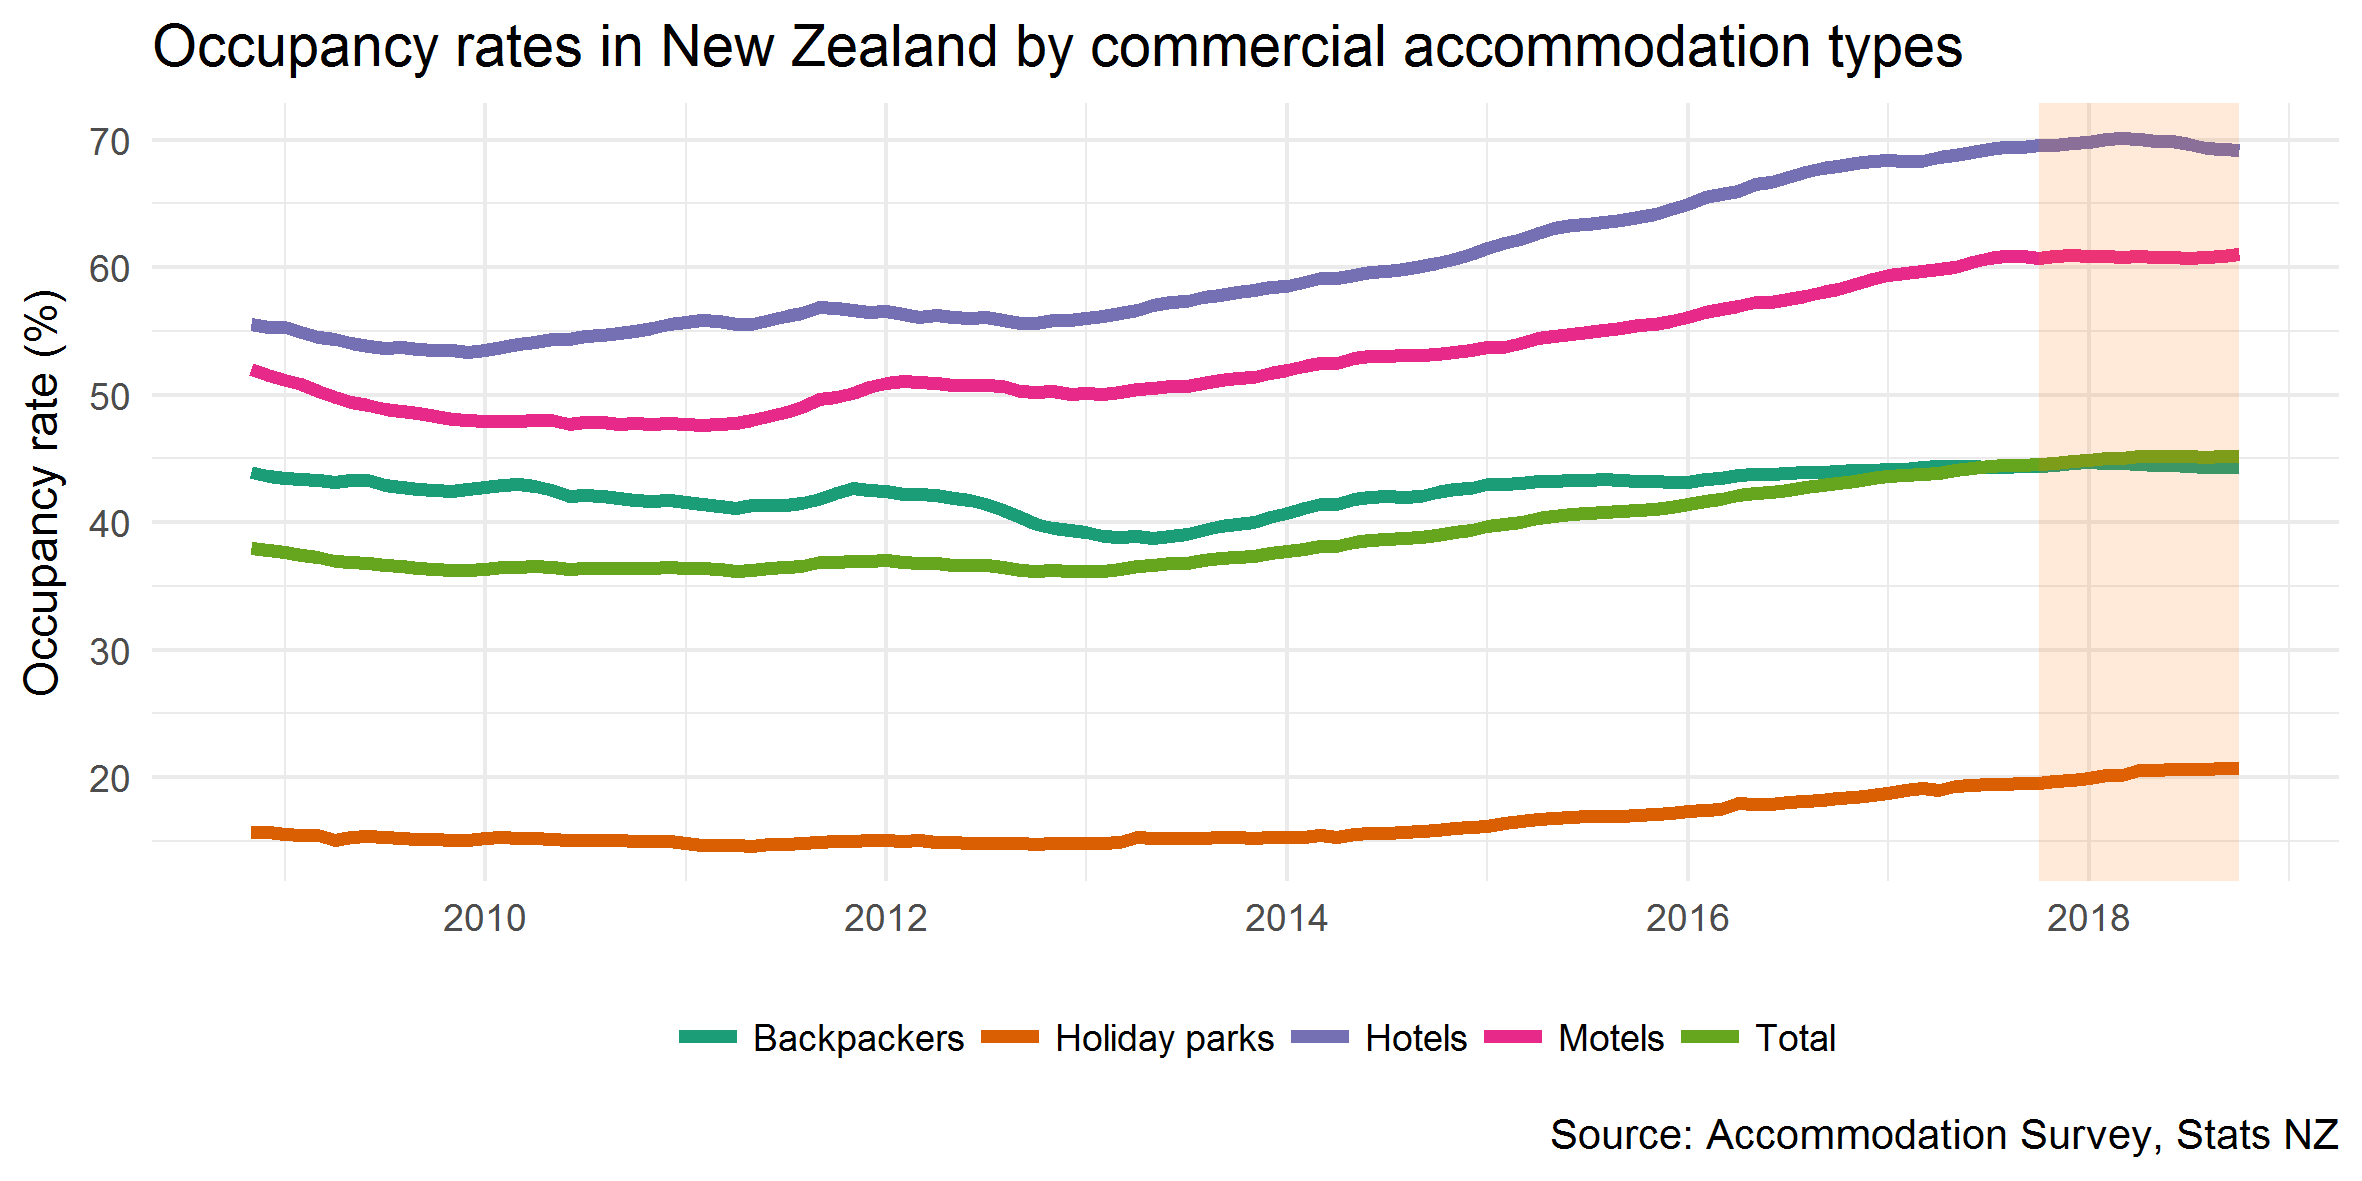
That said, national-level occupancy rates are not markedly different from the previous year, with the exception of holiday parks where there was a strong uptick in March.
While hotels (and to a lesser extent motels) reach very high occupancy rates, especially over summer, backpackers and holiday parks in New Zealand continue to have plenty of spare capacity across the year – even in peak months.
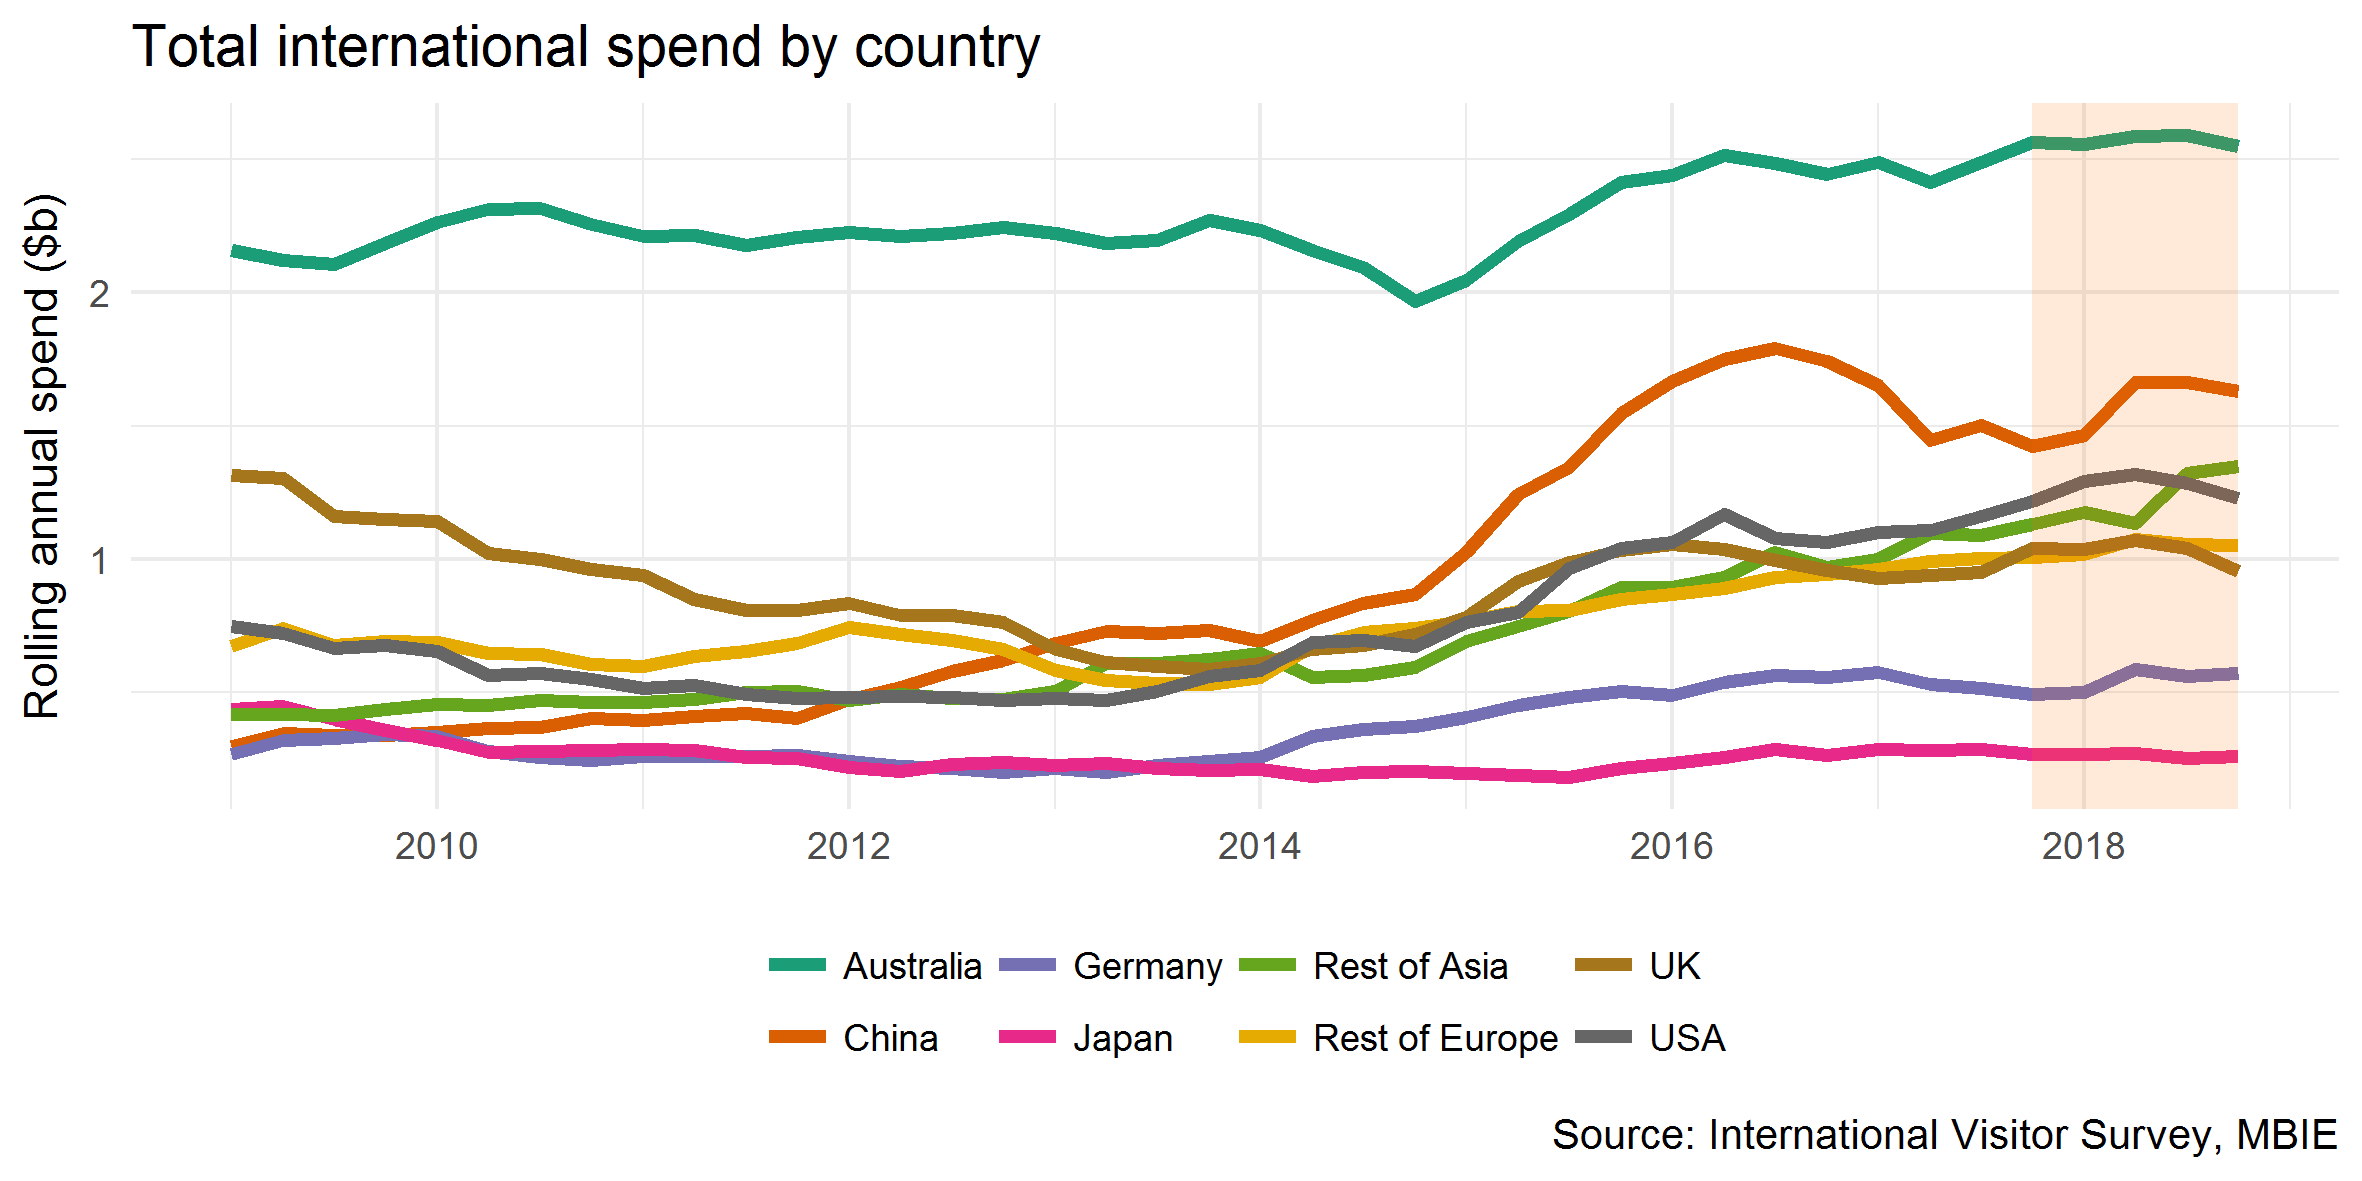
Spending from Chinese visitors was a major contributor to the overall rise in international tourism spend, up 14 per cent to $1.63 billion in the year ended September 2018. This coincided with a rise in the number of visitors from China, up 11 per cent over the same period. Average spend per visitor also grew, up four per cent.
Visitor spend from Germany showed strong growth, up a statistically significant 16 per cent to $572 million for the year ended September 2018. German average spend was up 17 per cent to $5,900. A weaker New Zealand dollar against the Euro (down nine per cent over the year) has meant that European visitors’ money has greater purchasing power, and that they were able to spend more when while in New Zealand. The German market also spends proportionally more on fuel than other markets. Therefore the rise in fuel prices seen recently (see the Fuel tab) is likely to have had a larger impact on this market, and could have contributed to the rise in spend.
Korea showed 37 per cent growth in total spend for the year ended September 2018. Over the same period, Korean visitor numbers increased 7.4 per cent. Korea is a particularly volatile market, however, with a relatively small sample size in the International Visitor Survey (<500). Nevertheless, the result was statistically significant, which means that we can say with 95% confidence that Korea spending raised this year.
Other Asia countries (excluding China, Korea and Japan) continue to be a major source of growth in international visitors. While Other Asia countries visitor numbers remain smaller than our main tourism markets, there has been remarkable growth over the year. For example, visitors from India grew 19 per cent, to 69,000; while the Philippines grew 21 per cent to 28,000; Thailand grew 15 per cent 31,000; and Indonesia grew 16 per cent to 26,000. Spending for Other Asia countries was $1.3 billion for the year ended September 2018, up 19 per cent from a year earlier.
The MRTE Insights Viewer presents tourism spend data from the Monthly Regional Tourism Estimates in a map and shows key breakdowns by area. Data is available at Regional Council, RTO region, and Territorial Authority areas. Click here to start exploring the MRTE Insights Viewer.
In 2017, 130 million outbound Chinese trips were made globally, reflecting an increase of seven per cent on 2016. By the first half of 2018, outbound Chinese tourism had already reached 71.3 million, an increase of 15 percent on 2017.
With more direct flights, favourable exchange rates, fewer visa restrictions, and increasing disposable income, Chinese outbound travel reflects major growth potential for the New Zealand market.
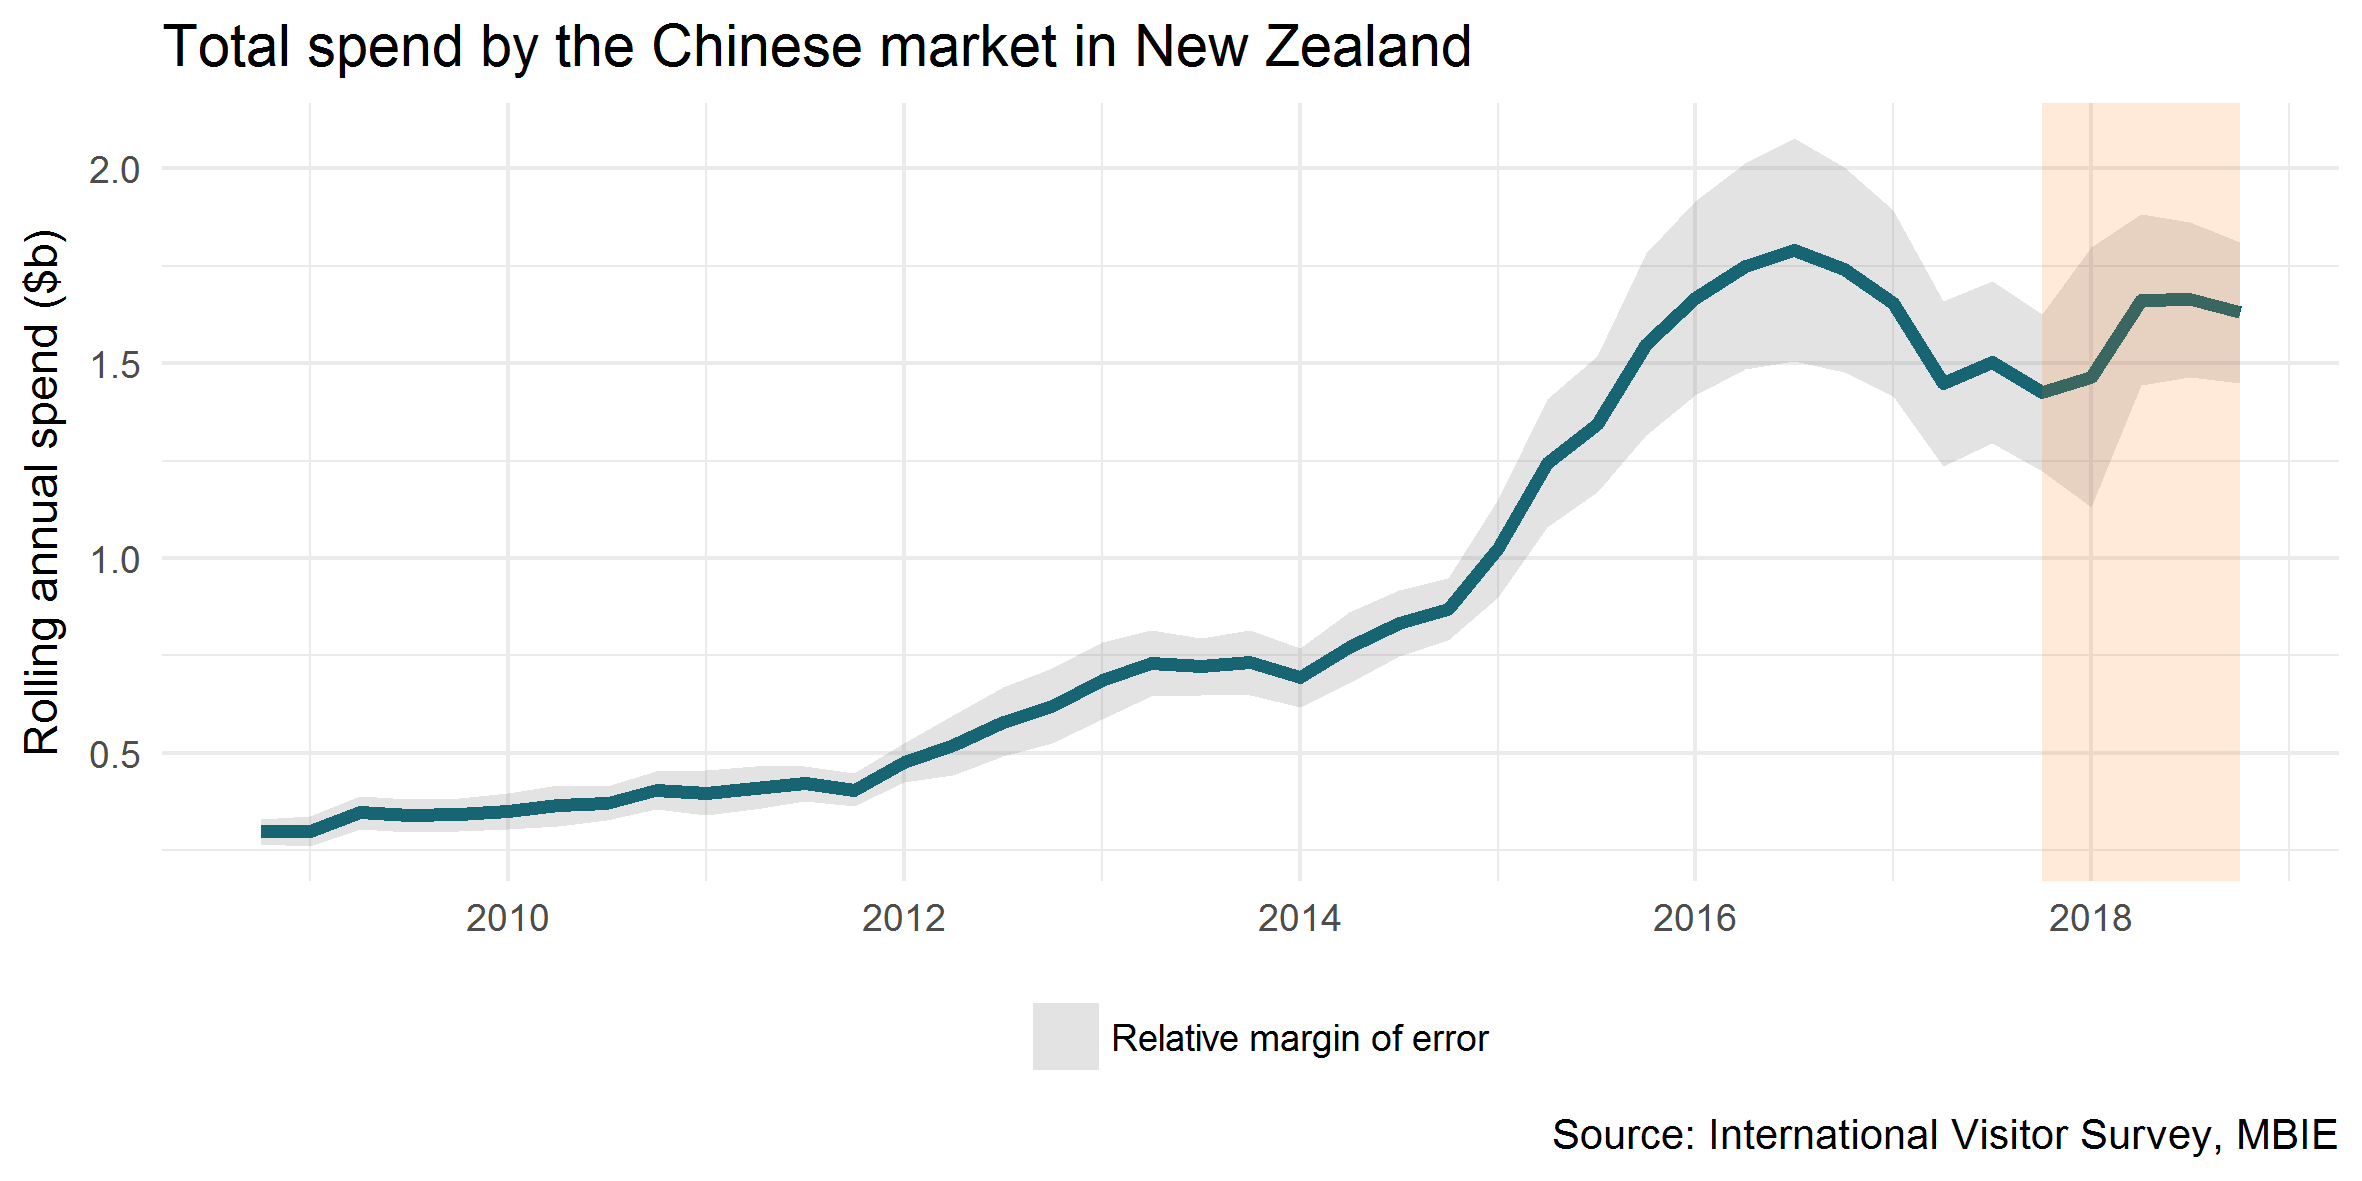
Total annual spend for the Chinese market was up 14 percent for the year ended September 2018, compared with the year before. This was driven by an 11 per cent increase in visitors from China and an increase of four per cent for average spend per visitor.
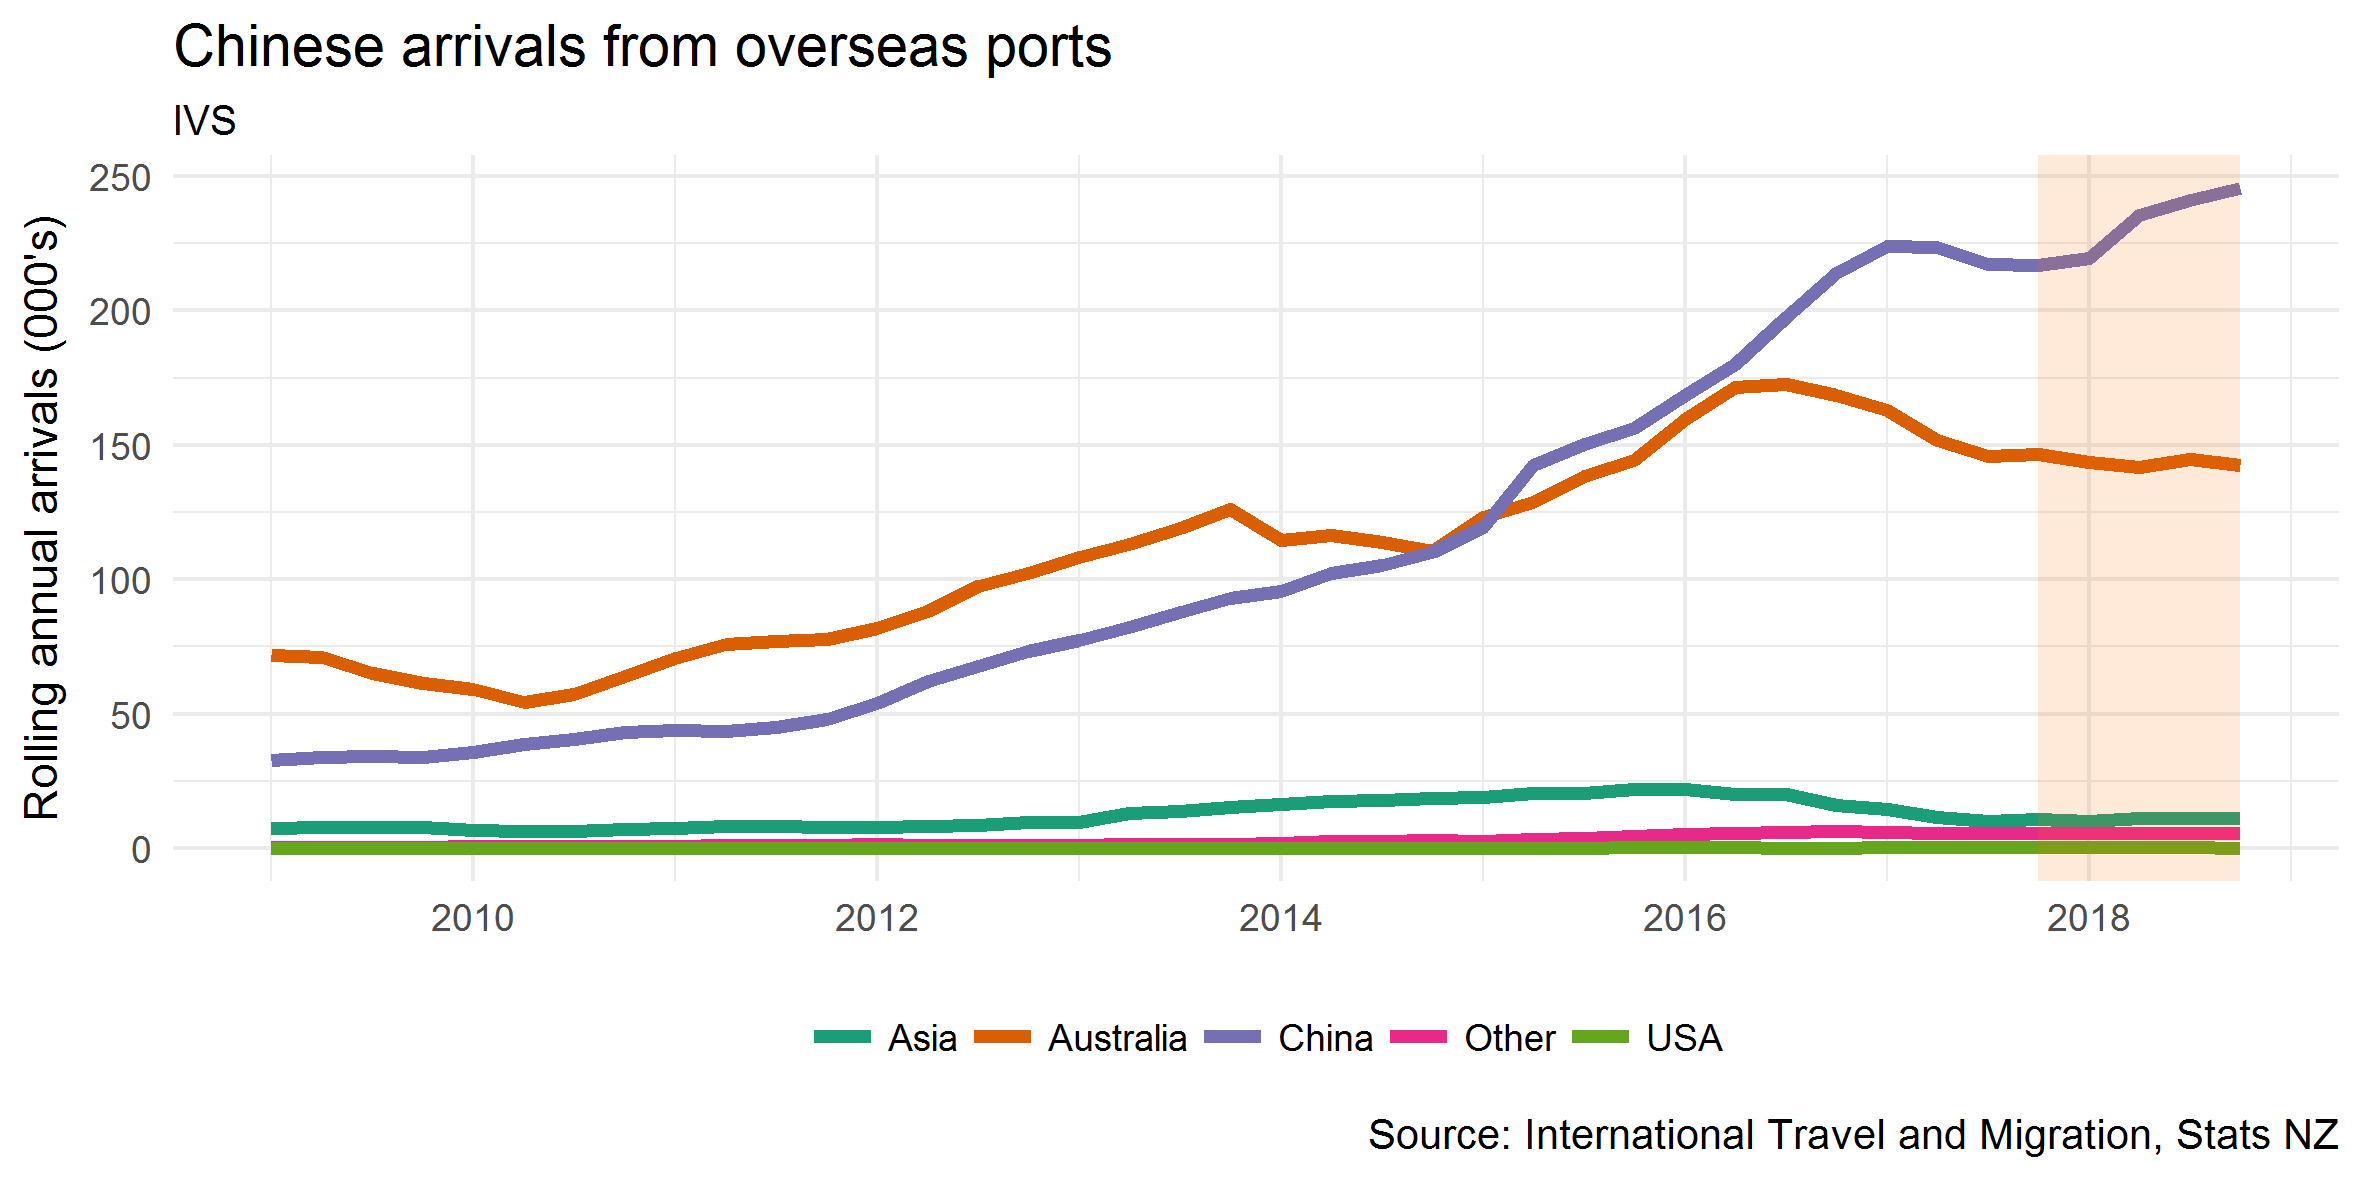
The total number of visitors from China increased substantially up 45,200 (11 per cent) to 453,000 in the year ended September 2018.
Shanghai, Beijing, and Guangdong province (containing the cities of Guangzhou and Shenzhen) remain the major points of departure for Chinese visitors to New Zealand.
Visitors direct from Guangdong, Shanghai and Zhejiang province grew considerably for the year ended September 2018, rising 21 per cent (up 14,600), 11.3 per cent (up 7,600) and 16.3 per cent (up 3,600) respectively. While visitor numbers direct from China have been increasing (up 13 per cent), those that arrive to New Zealand via Australia have decreased three per cent.
Arrivals from Guangdong province look set to grow further as China Southern Airlines increases capacity by 30 percent between Auckland and Guangzhou this summer, seeking to capitalise on the New Zealand China Year of Tourism in 2019.
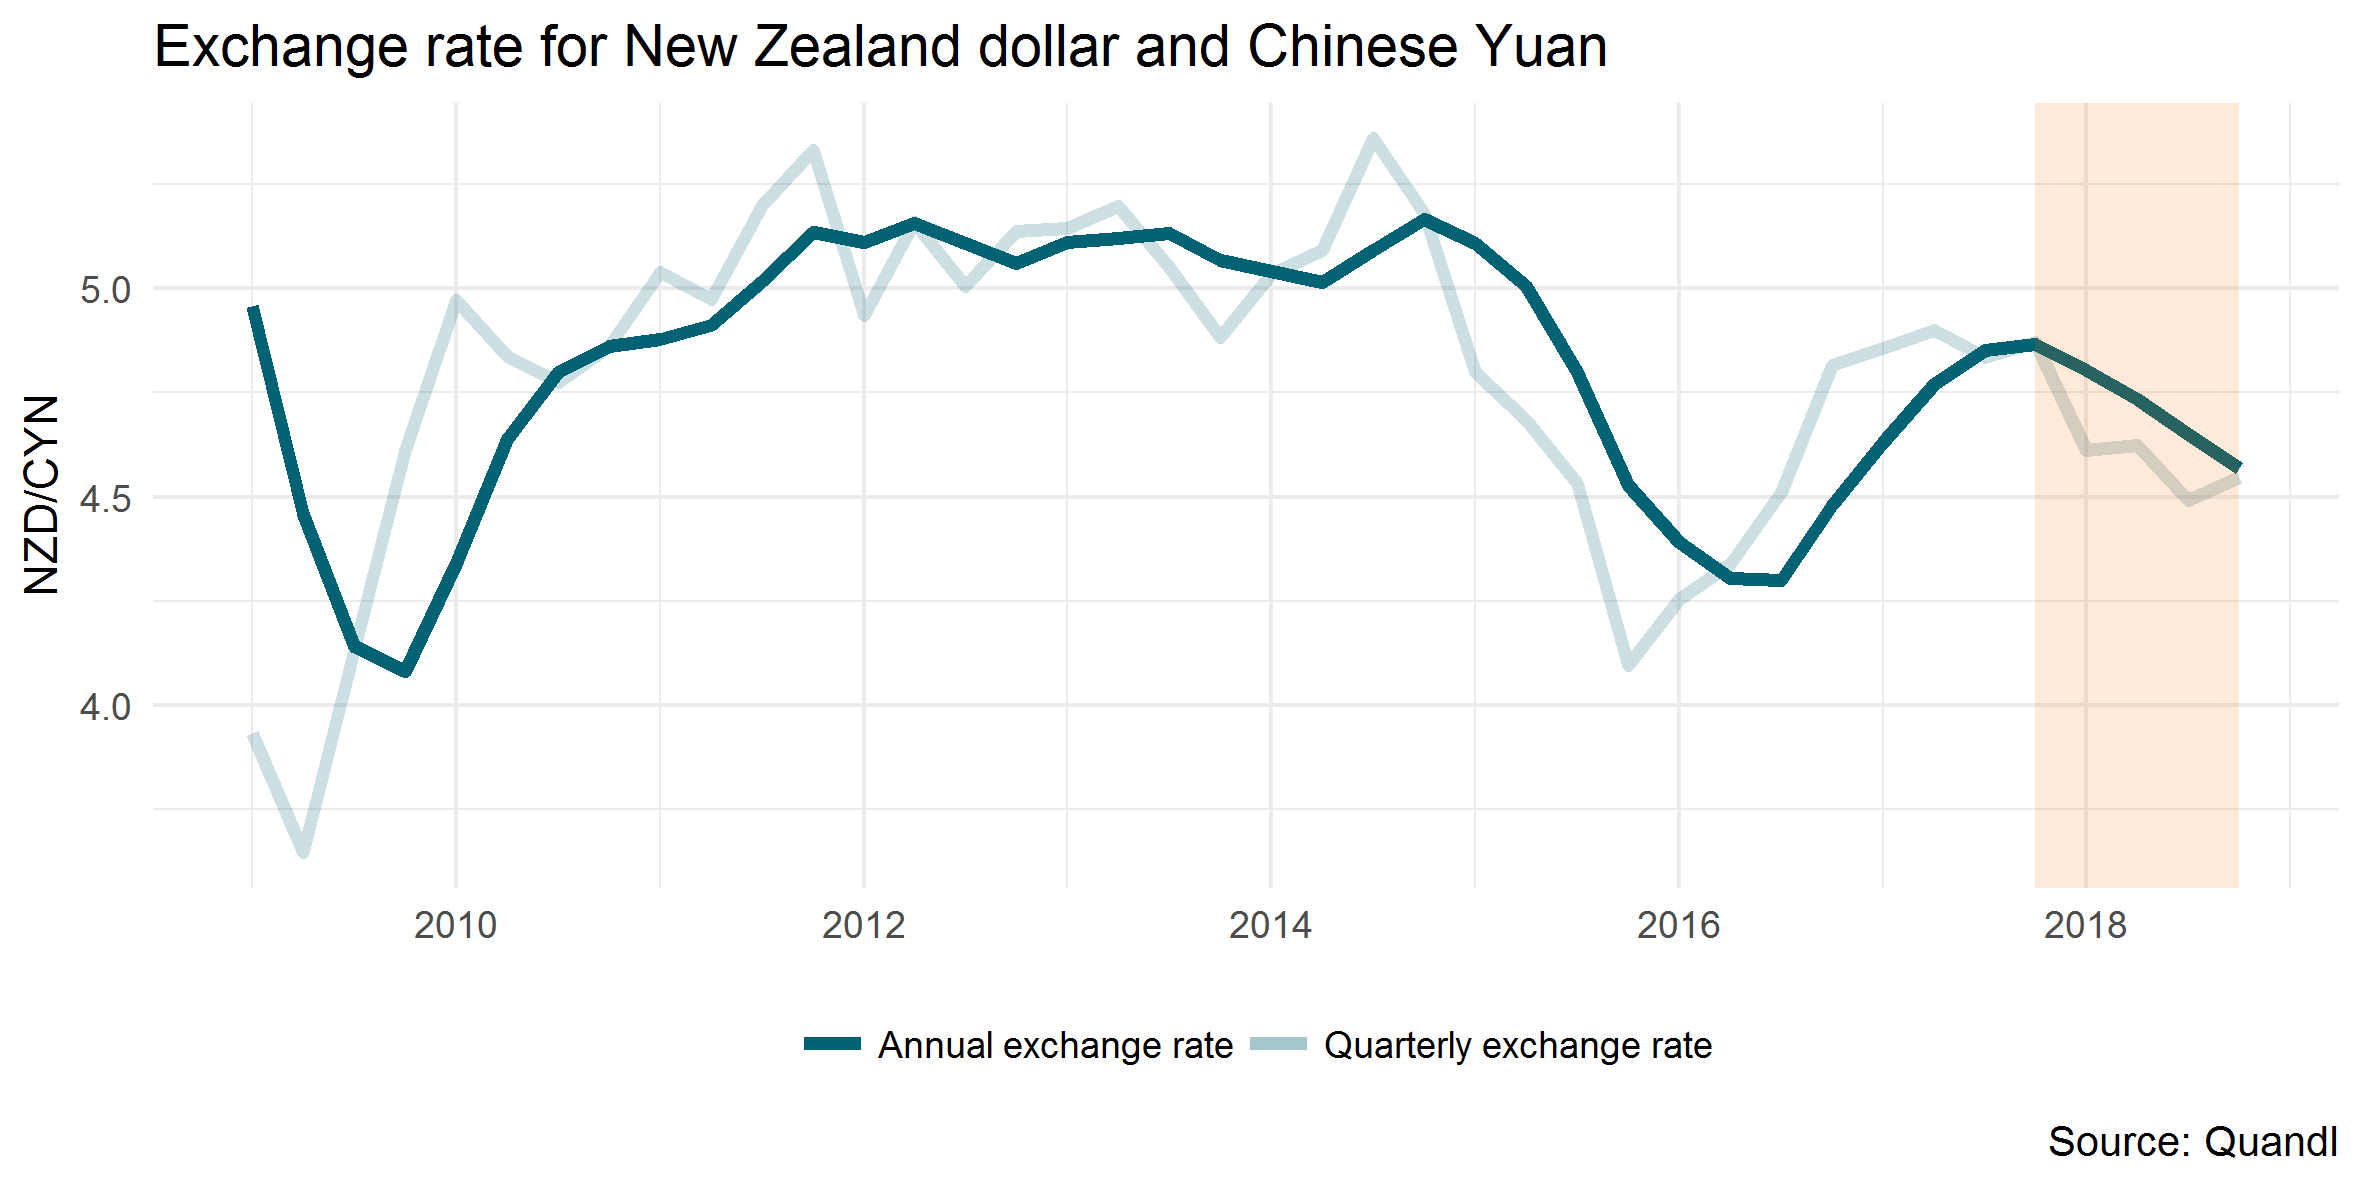
The quarterly exchange rate between the New Zealand Dollar (NZD) and the Chinese Yuan (CNY) fell nine per cent compared with the same quarter last year. This has given Chinese tourists greater purchasing power and is likely to be one of the main reasons behind the increase in average spending for the market.
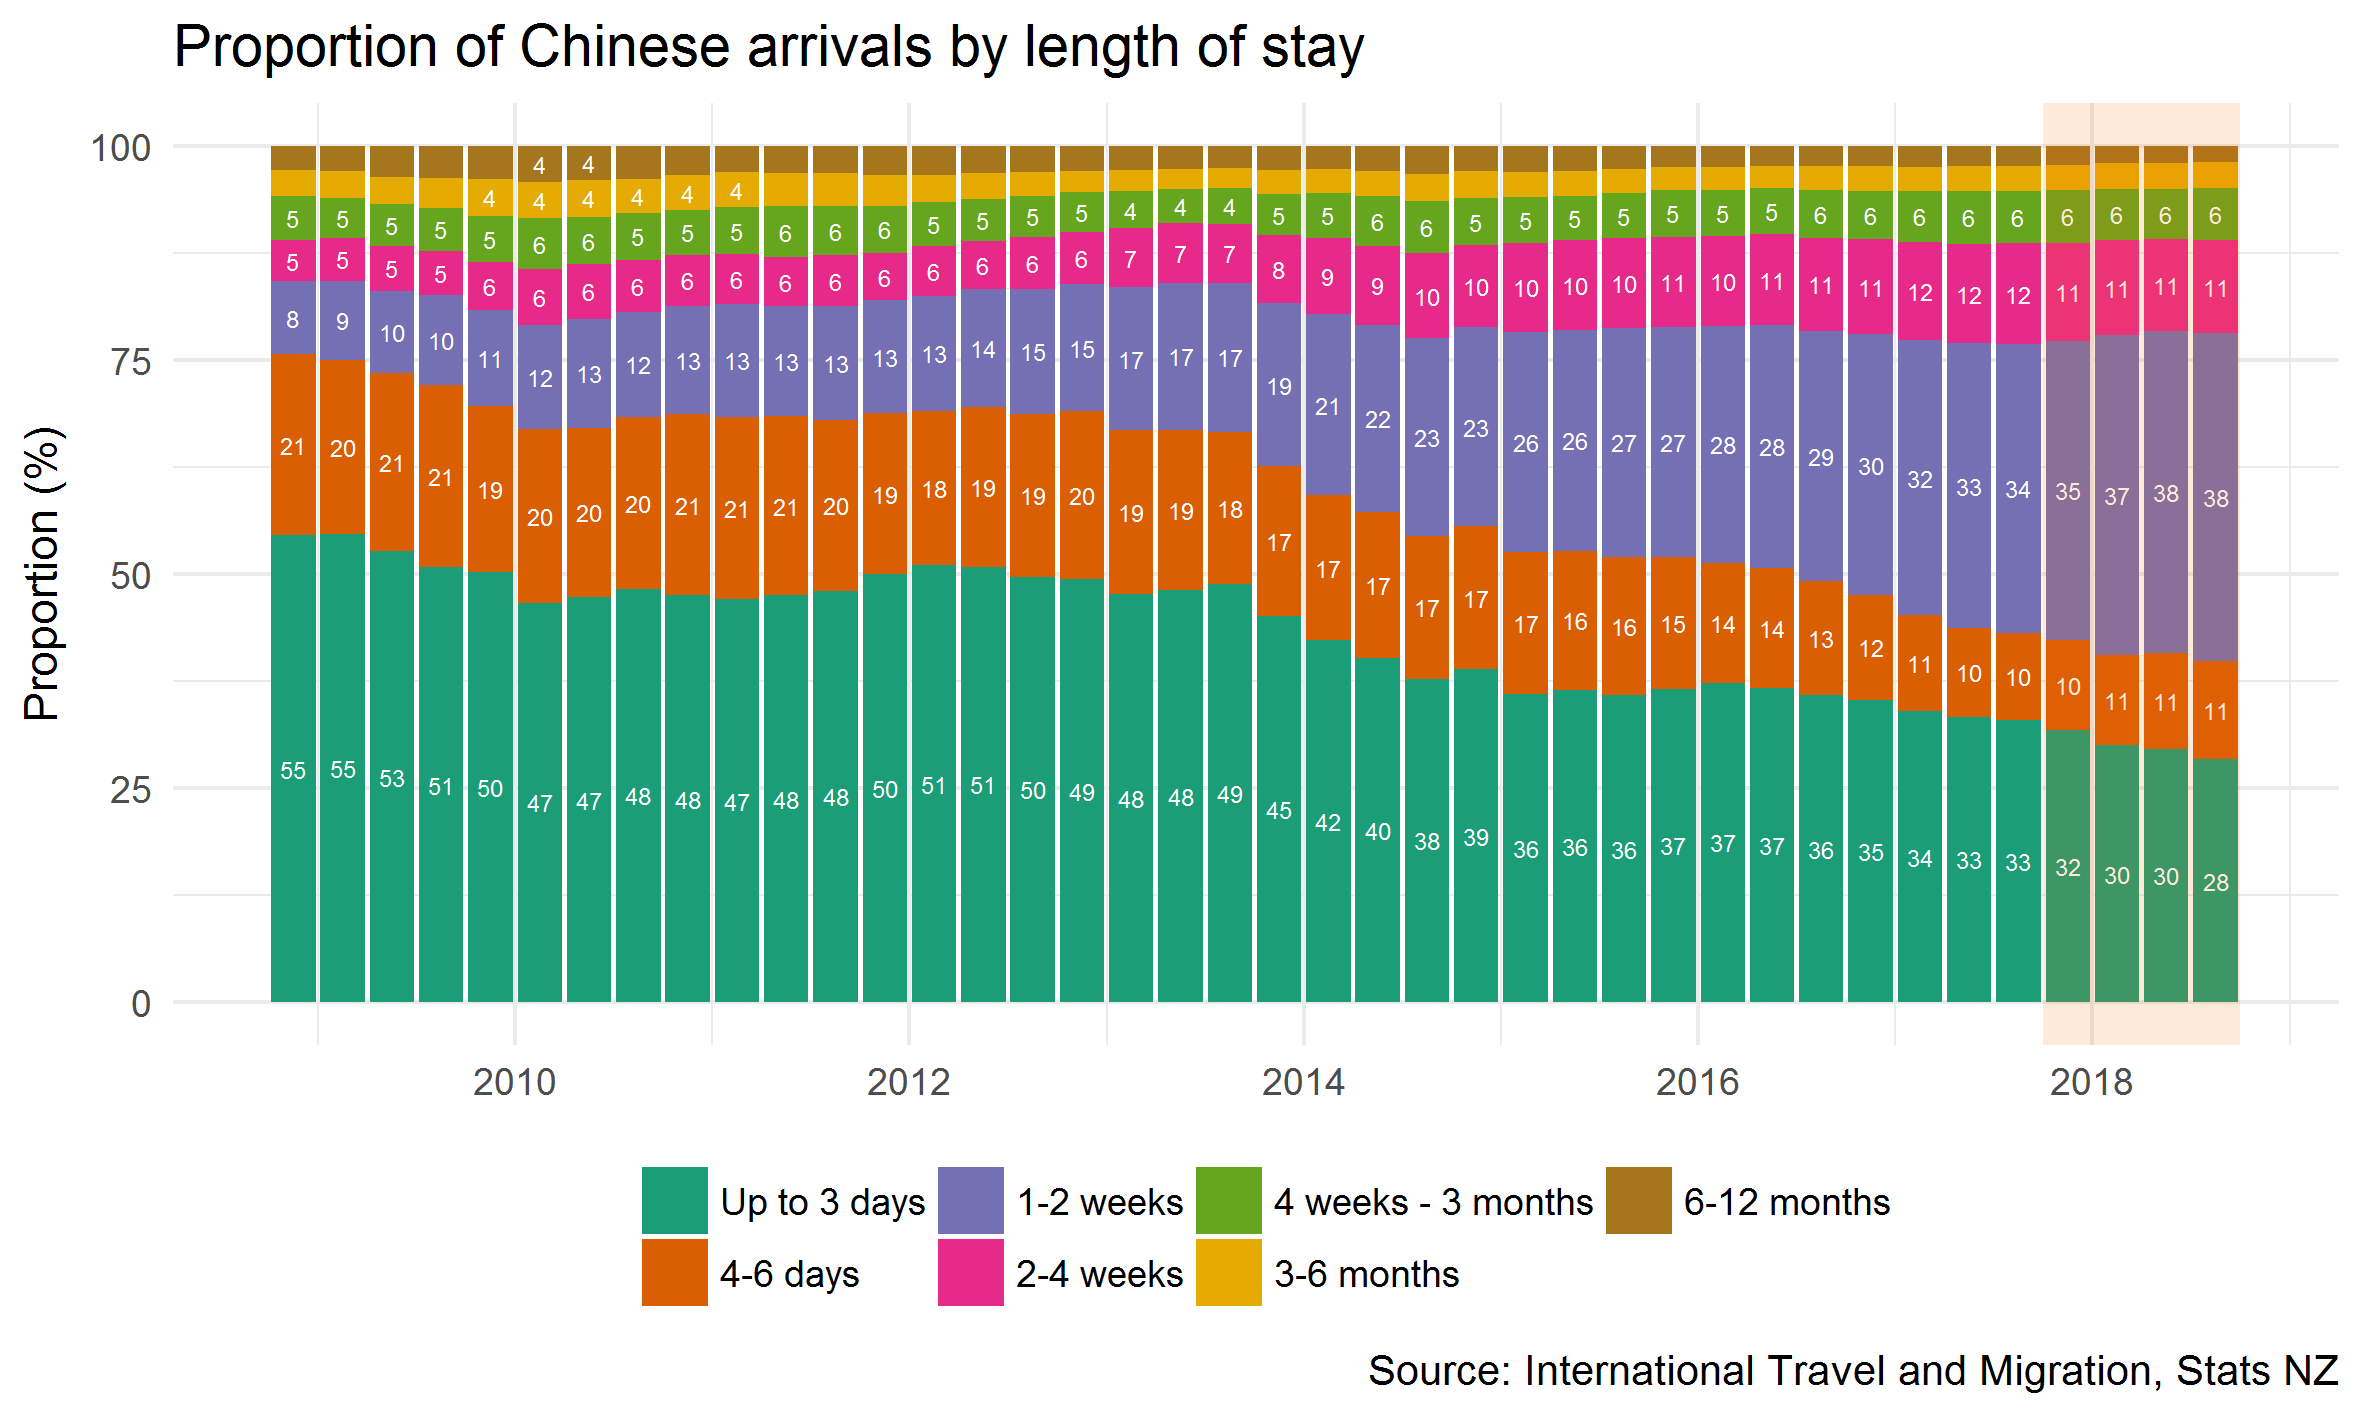
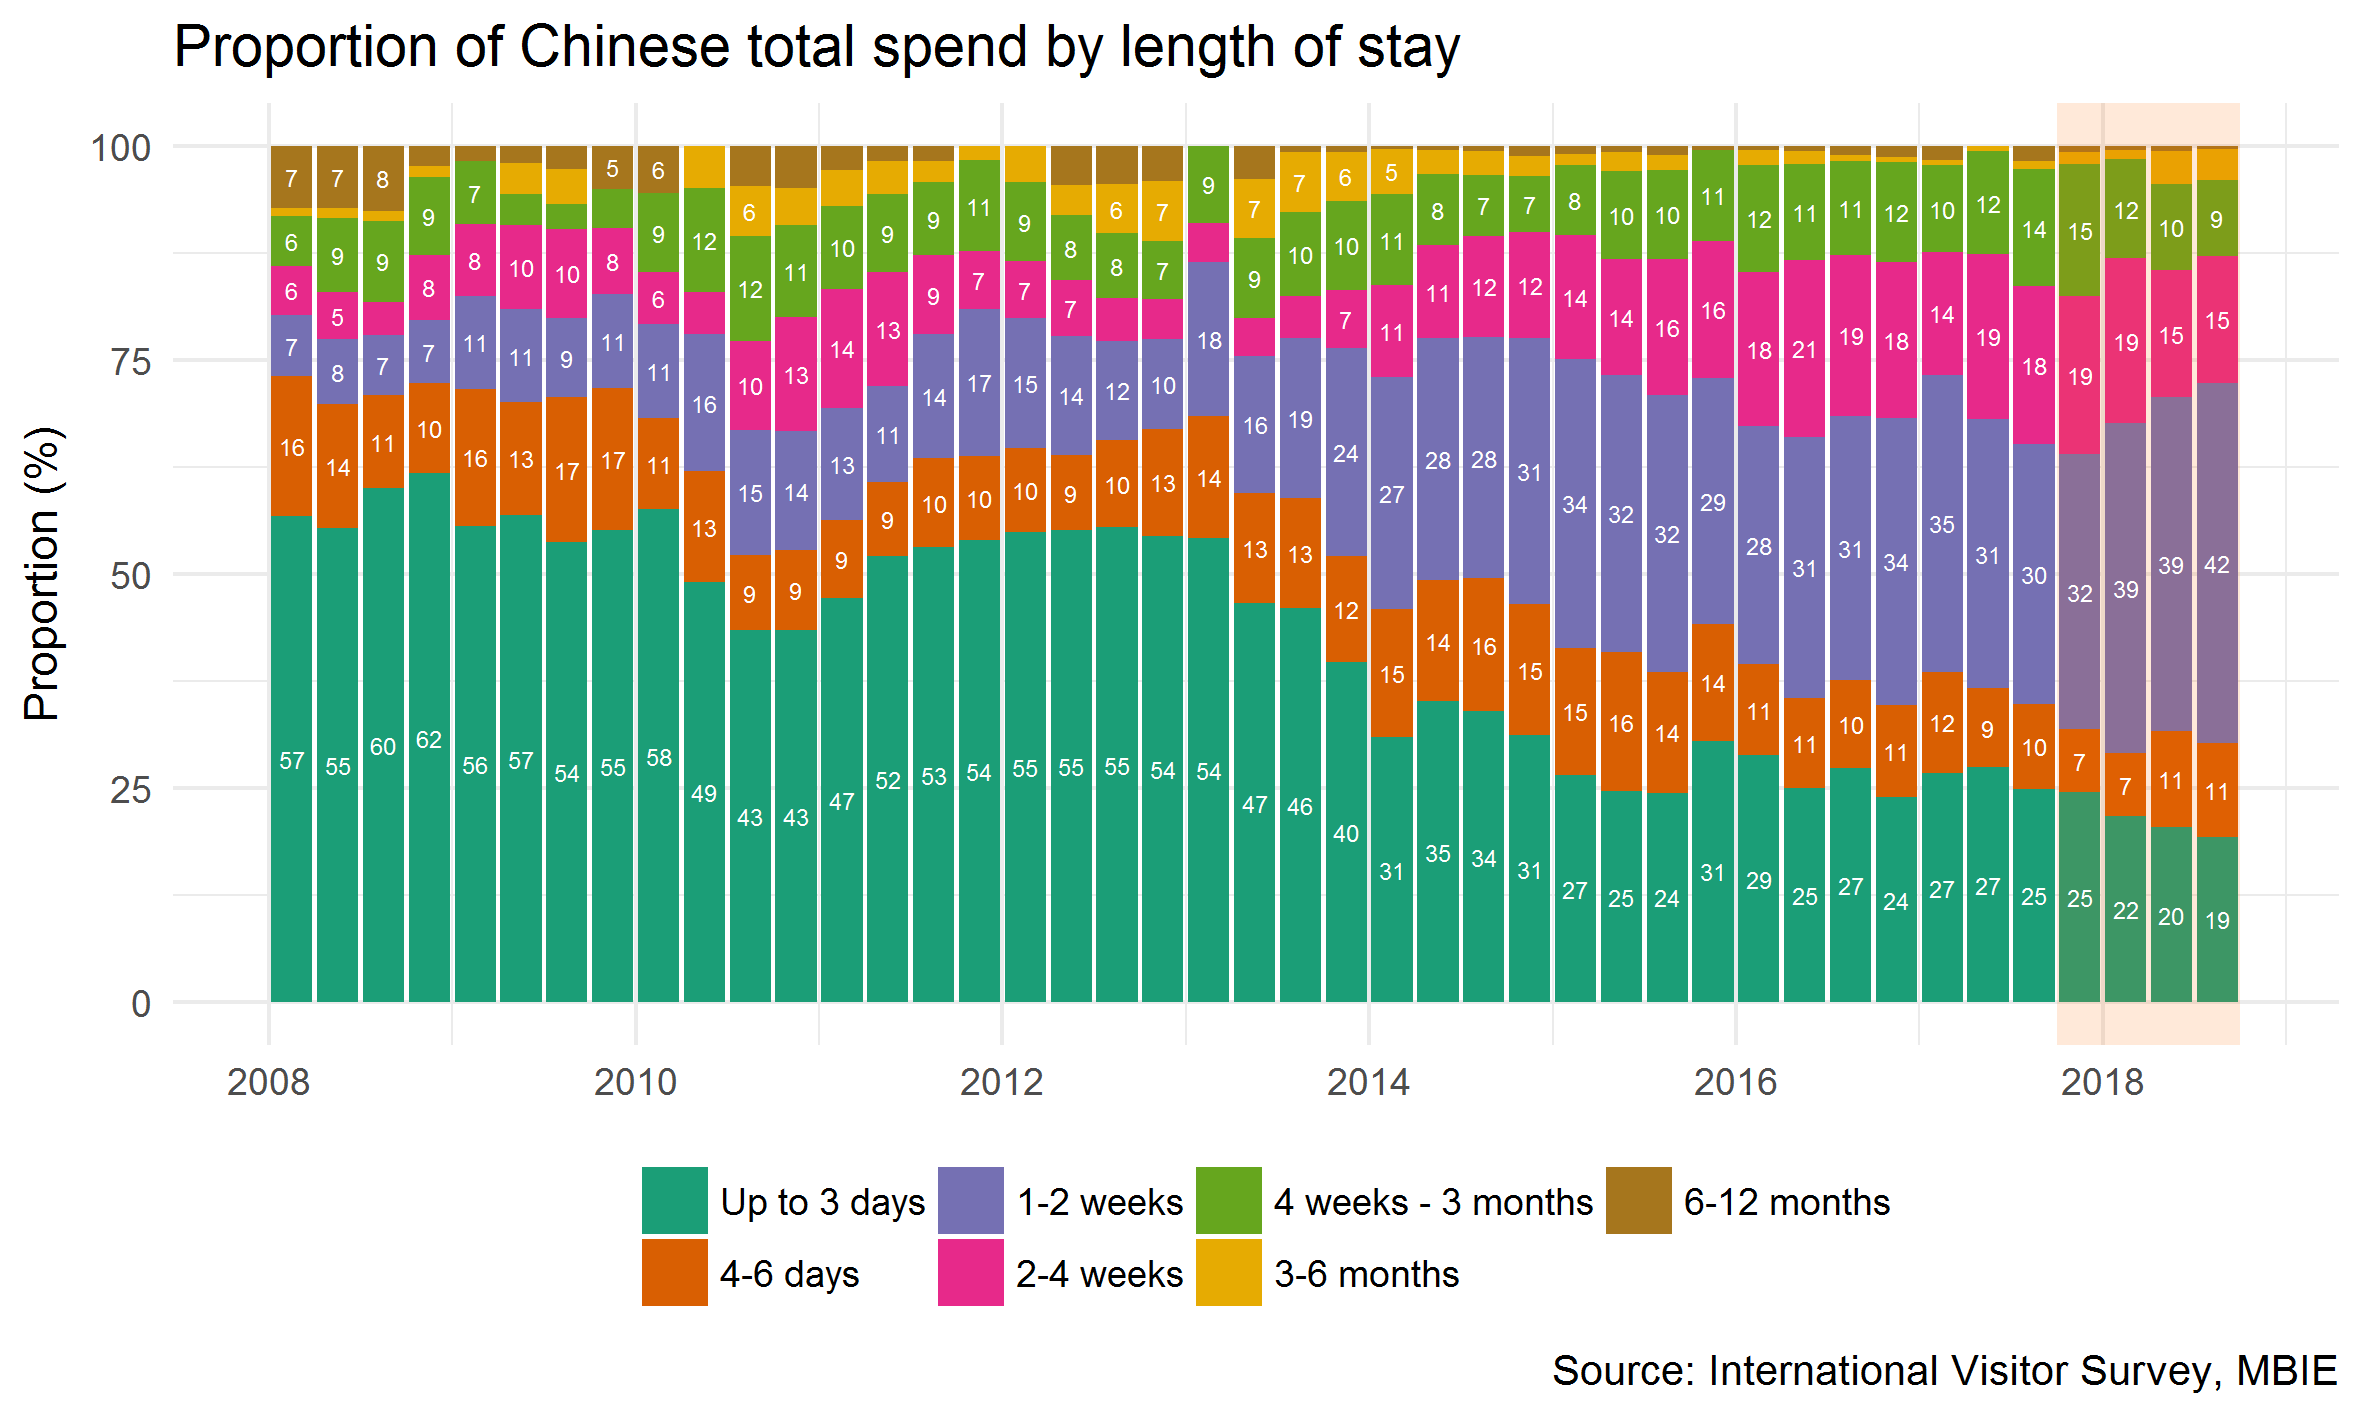
The number of visitors on very short trips (of up to 3 days) continues to decline, down a further 4.1 per cent for the year ended September 2018. This is in contrast to those arriving for 1-2 weeks and 4-6 days, up 26.4 per cent and 23.3 per cent respectively.
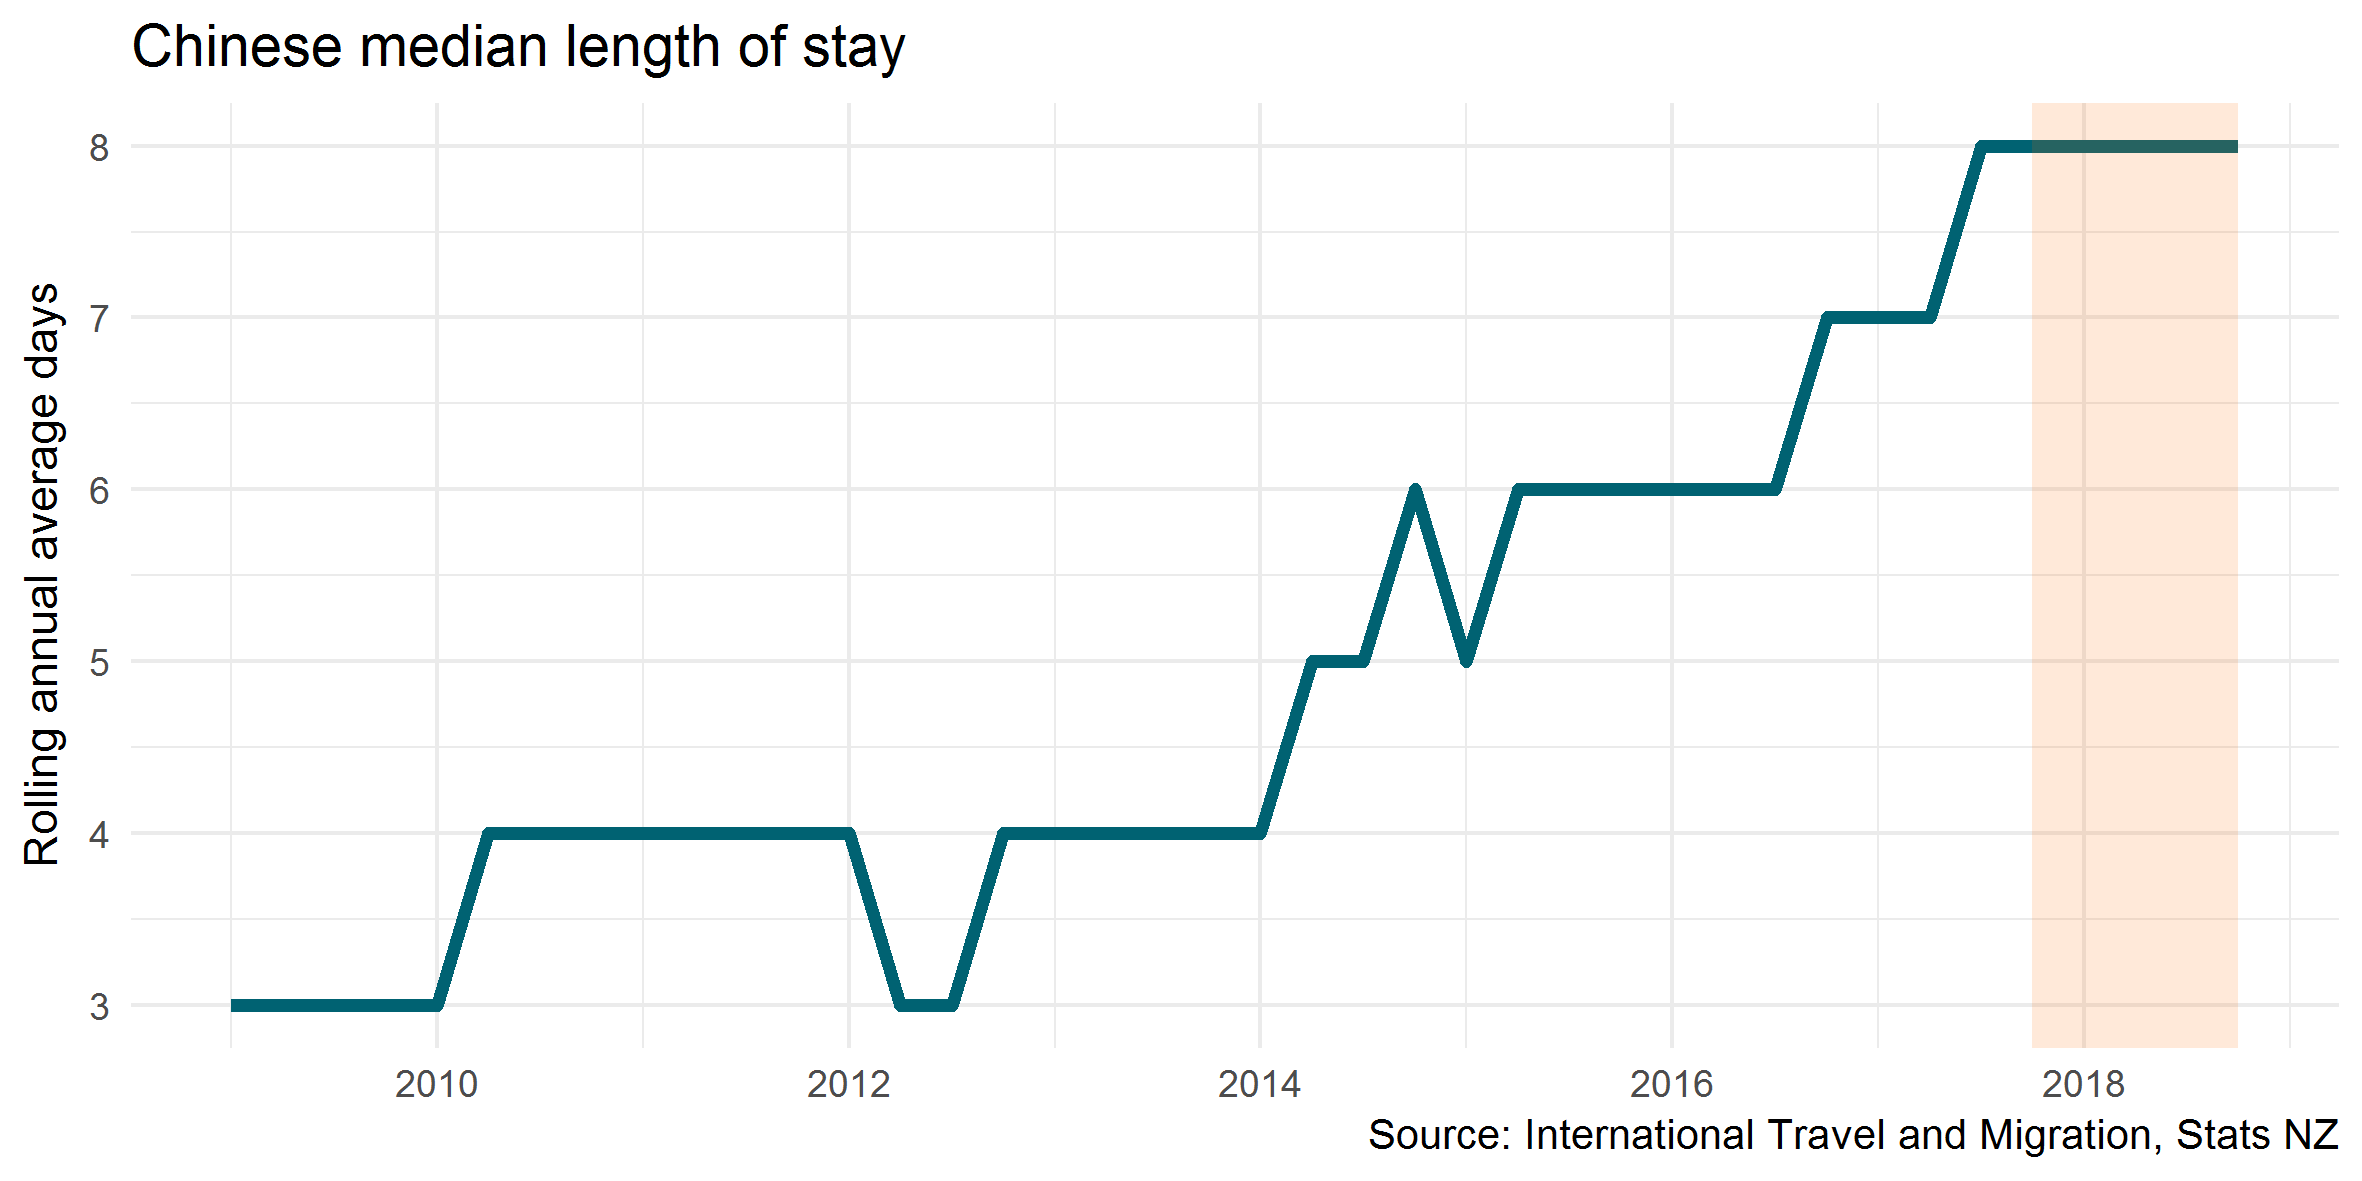
This trend towards slightly longer term trips in the Chinese market has resulted in the median length of stay more than doubling since 2012.
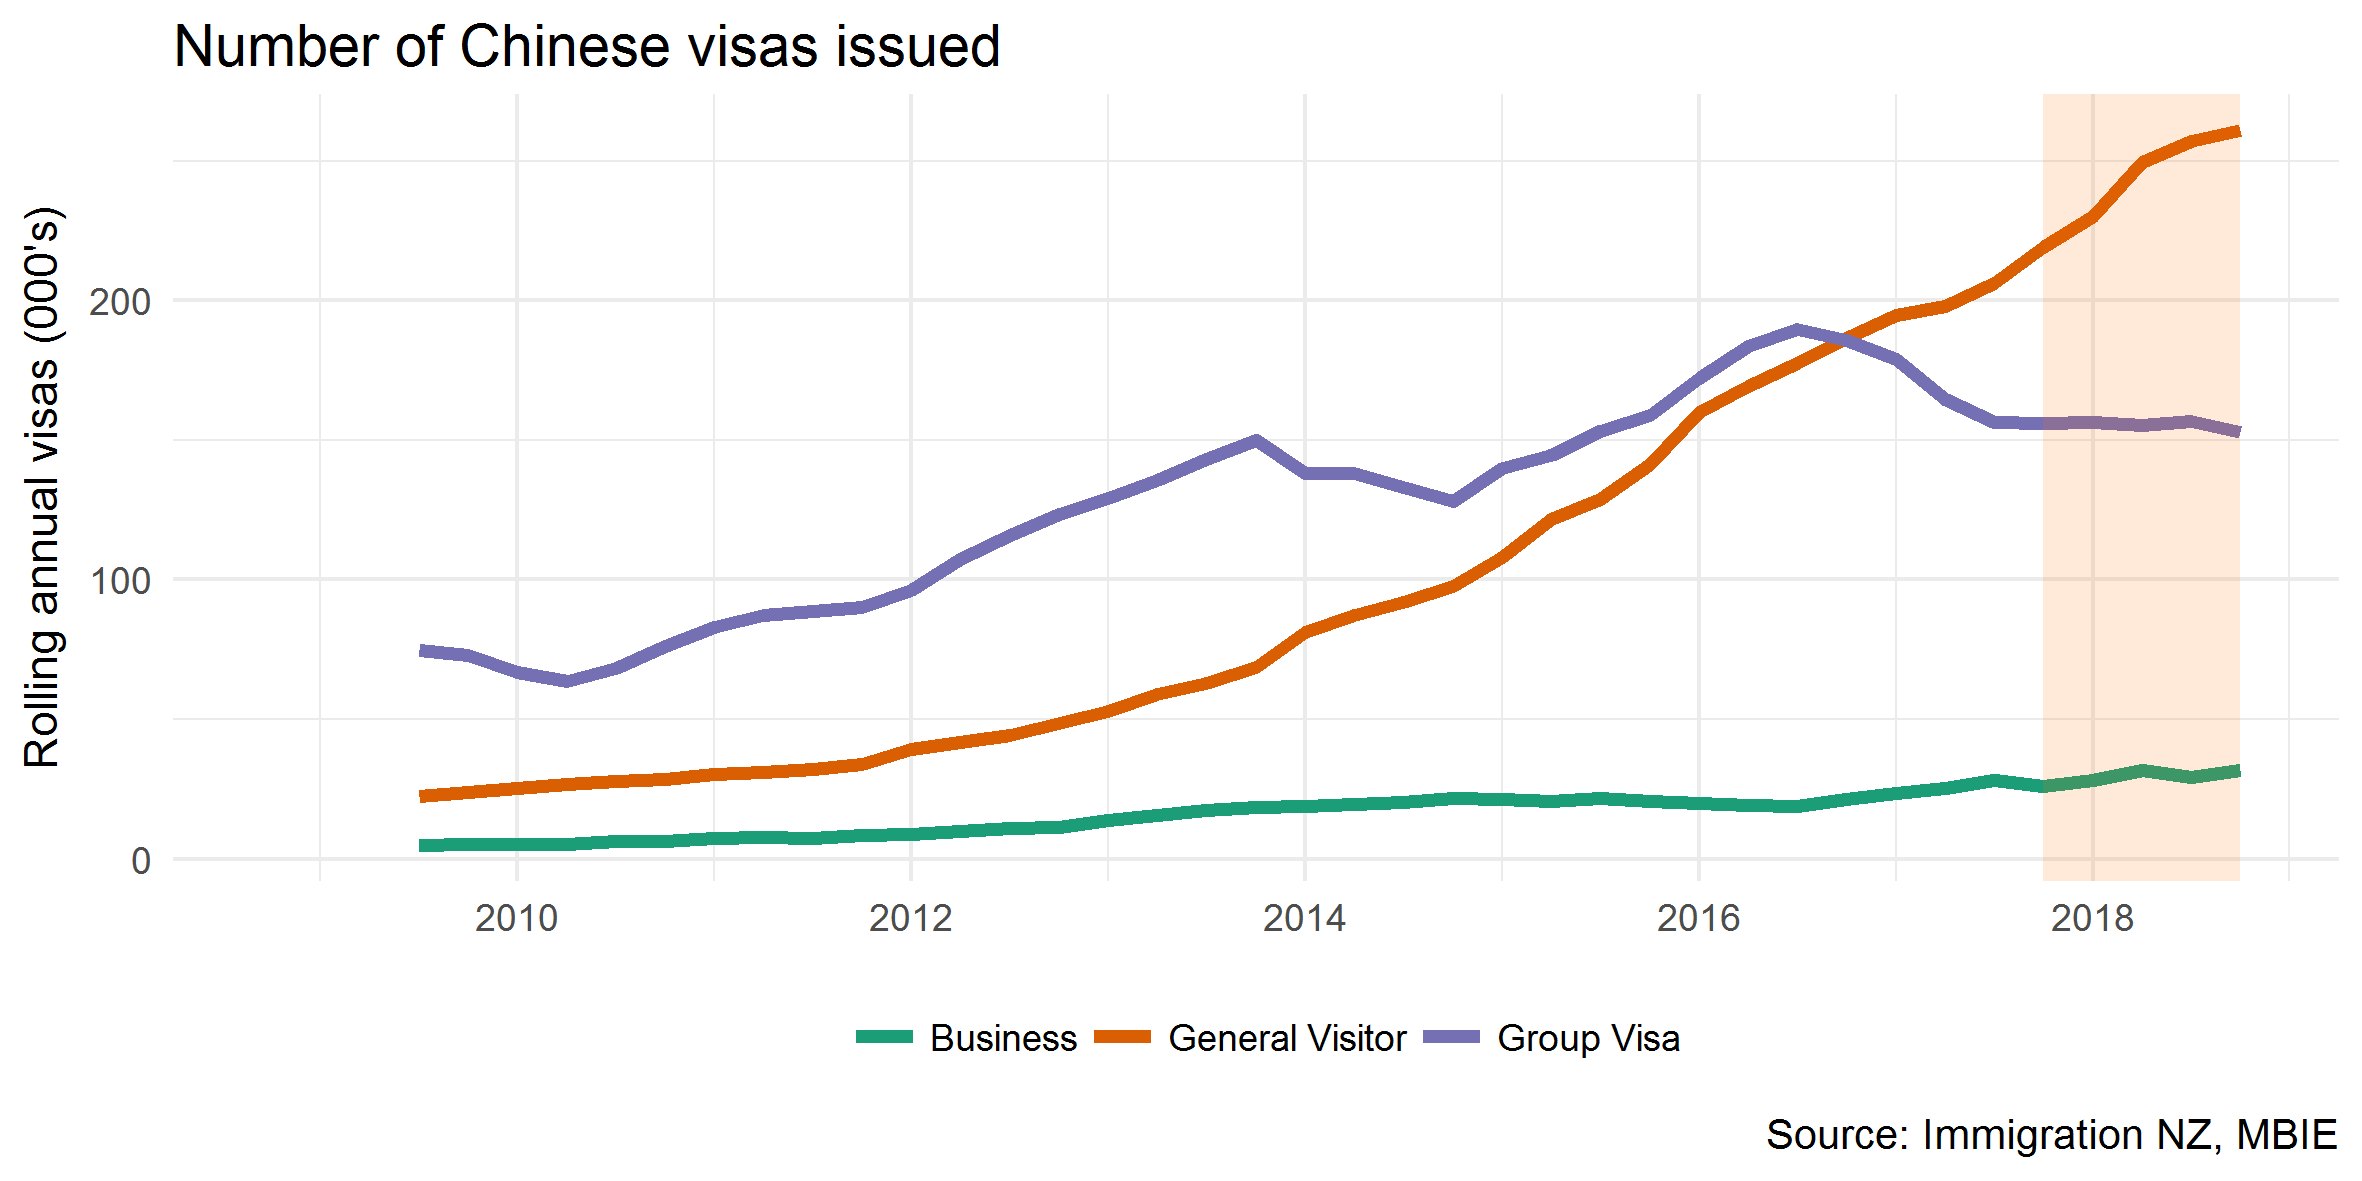
One of the reasons for the increasing median length of stay has been the large increase in the number of Chinese general visa applications to New Zealand since 2012. This segment of the market is more associated with independent travel and longer stay trips, and continues to grow, up 19 per cent for the year ended September 2018. The Approved Destination Status (ADS) visa, more associated with packages and tours and shorter stay trips, has not seen the same level of increase. The number of applications is similar to that in 2013 and is likely the main reason why the number of visitors staying up to 3 days has been declining.
The increase in the median length of stay will likely have contributed to an increase in average spending per trip in the Chinese market, as the longer visitors stay, the more they spend on average.
In the year ended September 2018, the total spending of the visitors staying for 1-2 weeks made up 42 per cent of the market, and has overtaken the amount spent by those staying for less than a week.
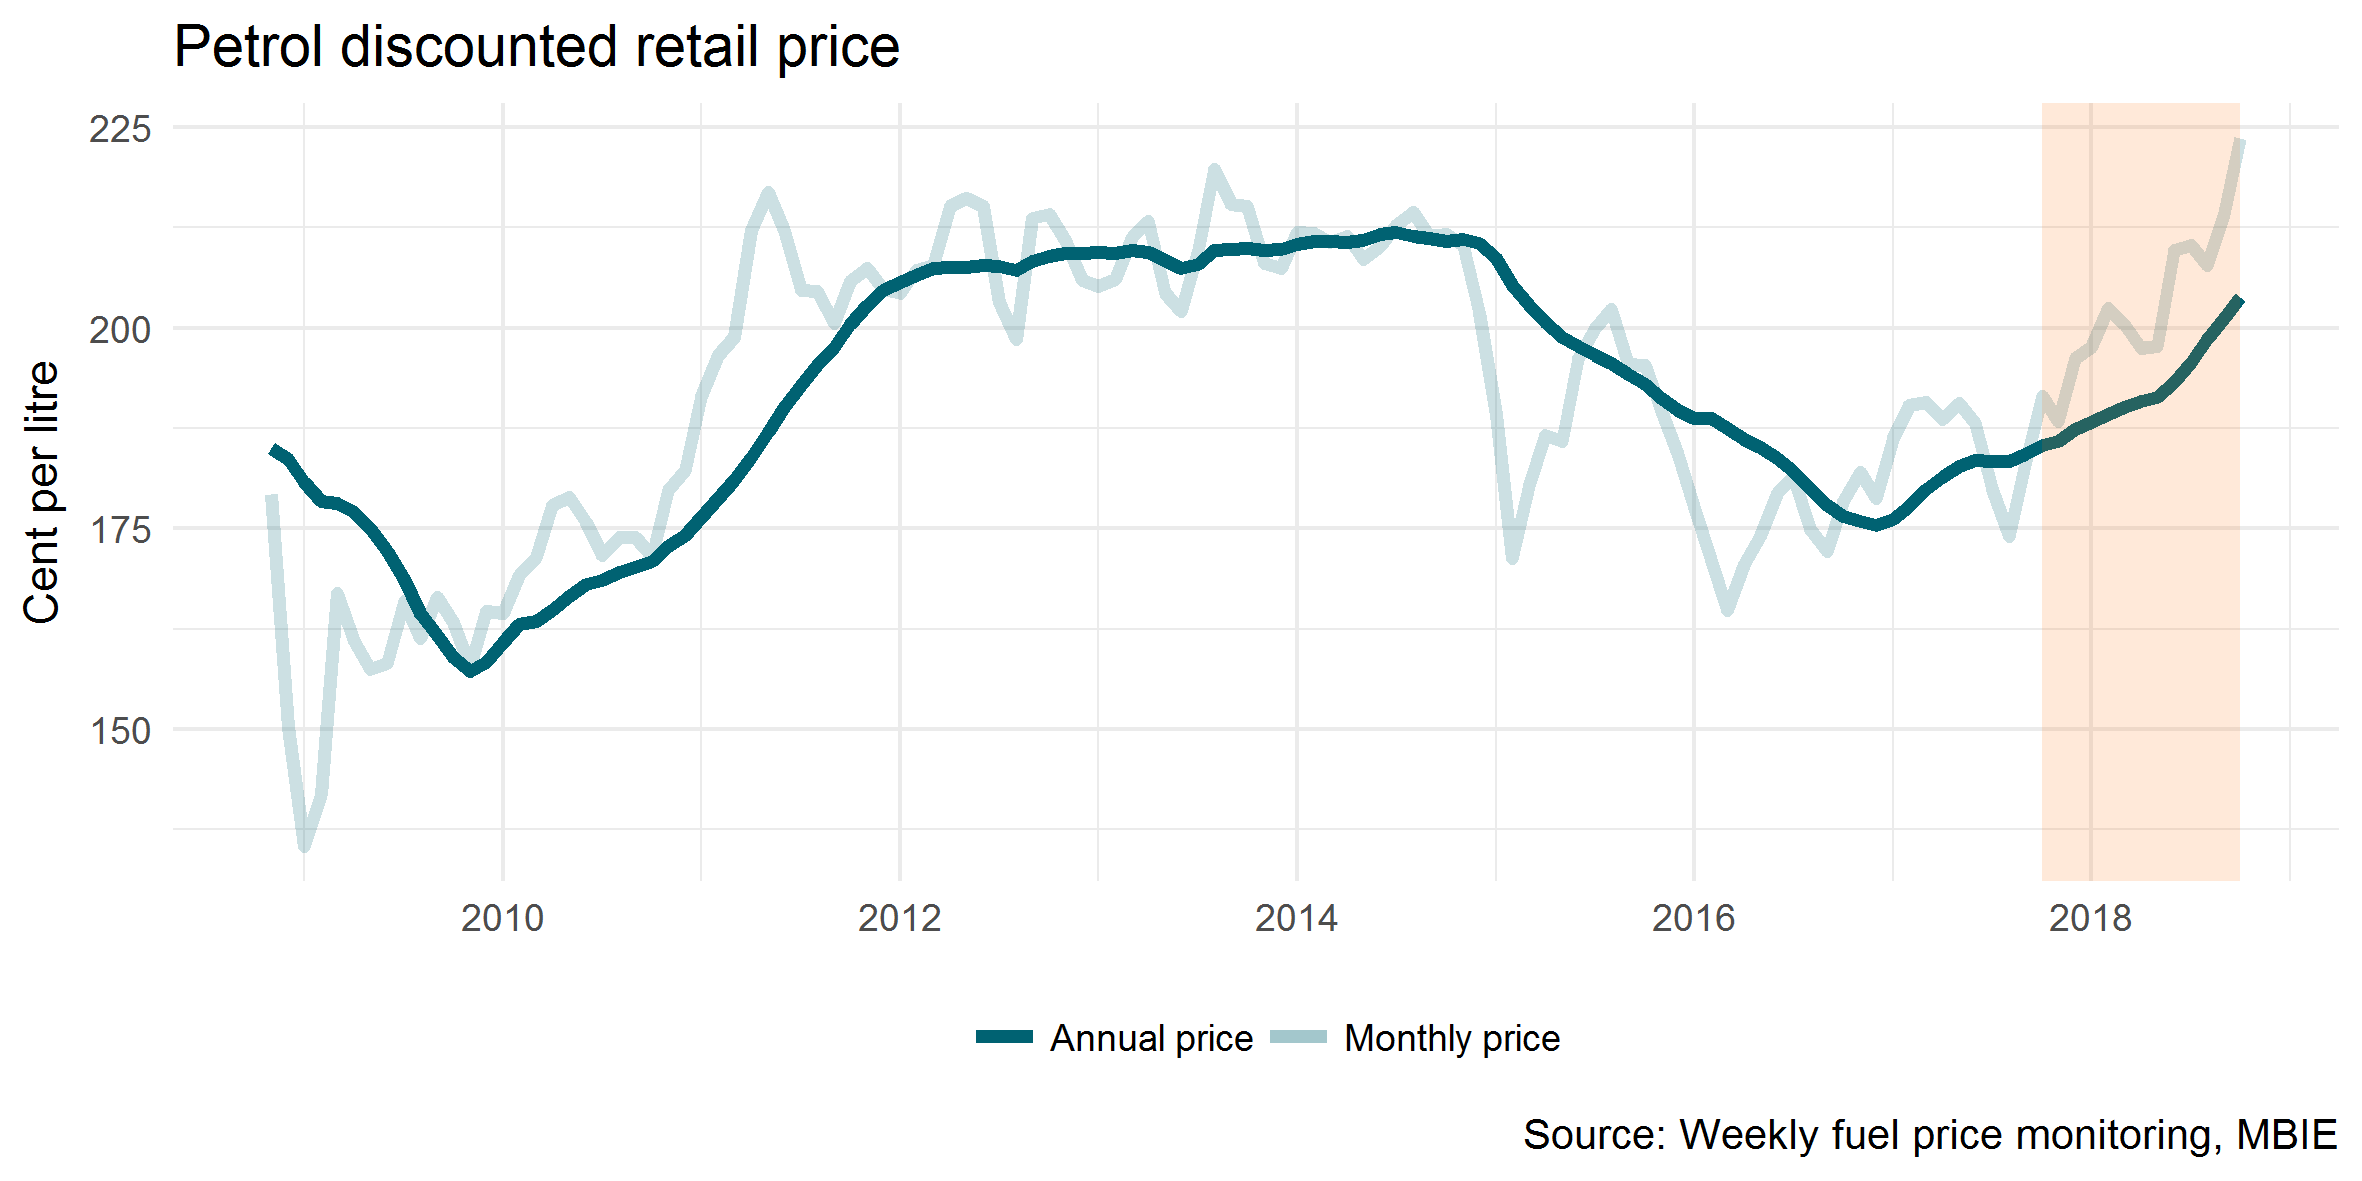
The price of fuel in New Zealand has increased significantly over the year ended September 2018, due to an increase in global fuel prices. The discounted retail price of fuel for the year was up 10 per cent, with the September quarter price up 18 per cent on the same quarter last year. This has resulted in the price per litre rising above the highs seen in 2011 to 2014.
This increase in the price of fuel appears to have heavily affected tourism spending in the category ‘retail sales - fuel and automotive products’ (made up of mostly fuel retailing so will be referred to as fuel going forward). There has been a 17 per cent increase in total tourism spending in fuel, the fast growing category in the Monthly Regional Tourism Estimates. International spending on fuel had the highest growth, up 21 per cent, with domestic spending on fuel up 15 per cent.

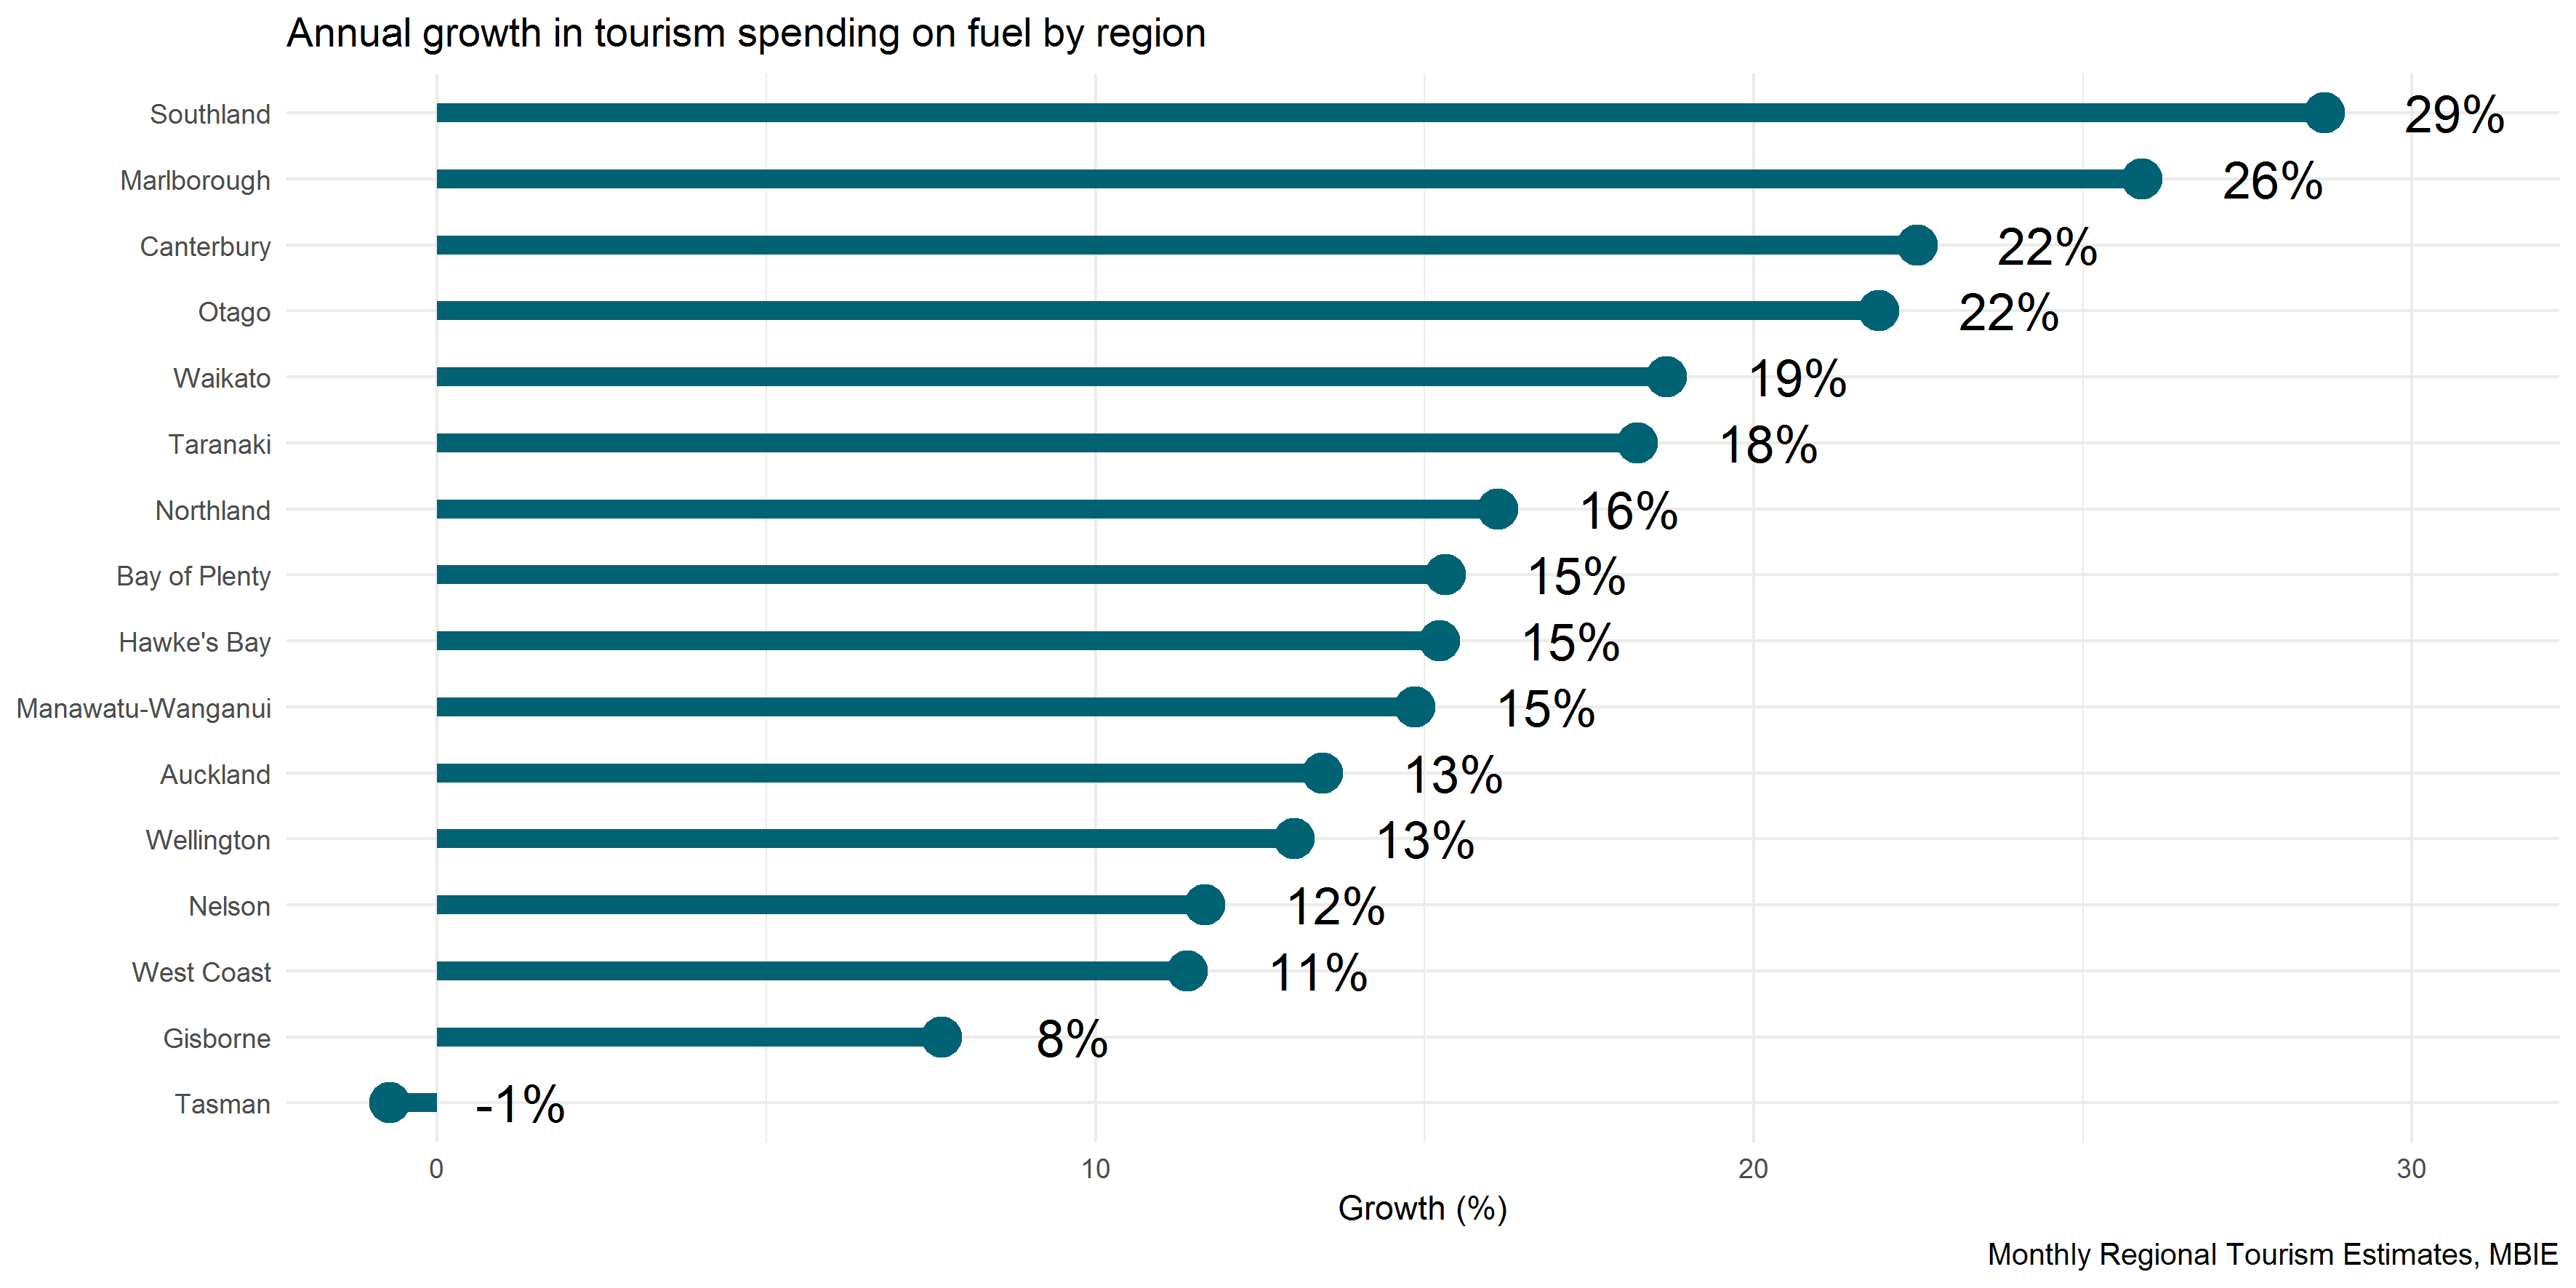
Looking at tourism spending on fuel at the regional level, Southland region was the fastest growing, up 29 per cent. The top four regions with the highest growth in spending in fuel were on the South Island, with the other three being Marlborough (up 26 per cent), Canterbury (up 22 per cent) and Otago (up 22 per cent).
The West Coast and Tasman received the highest proportions of tourism spending on fuel in the year ending September 2018 (23 and 19 per cent respectively), however they had lower growth rates in spend on fuel compared to other regions on the South Island. This may have occurred because of the large growth rates seen the year before (Tasman up 38 per cent and the West Coast up 20 per cent year ended September 2017), likely due to increased volumes of visitors driving through these regions after Highway 1 was closed following the Kaikoura earthquake.
Although Auckland only received five per cent of tourism spending from fuel, it still has the second highest amount spent in this category in New Zealand, following Canterbury.
It is difficult to determine the indirect impact that increases in fuel prices have on spending in other categories. Spending in ‘retail sales - fuel and other automotive products’ makes up nine per cent of all tourism spending in New Zealand.
The QTR covers the performance of the tourism sector over the last year – in this case, the year ended September 2018. The report draws on data from a range of sources, including:
The International Visitor Survey (IVS) was developed to provide accurate, quarterly, national information on the expenditure of international visitors to New Zealand, as well as their behaviours and characteristics. In particular, the main purpose of the IVS is to measure the total annual expenditure by international visitors in New Zealand. In addition, the IVS:
The Monthly Regional Tourism Estimates (MRTEs) provides estimates of regional tourism spend for international and domestic travellers, broken down by country of origin and tourism product. The estimates are developed using:
International Travel and Migration Statistics are produced by Stats NZ from arrival and departure card information. This data provides the number of overseas visitors, New Zealand resident travellers, and permanent and long-term migrants entering or leaving New Zealand.
The Accommodation Survey is run by Stats NZ by surveying all economically significant hotels, motels, holiday parks and backpackers in New Zealand. The survey provides information about short-term commercial accommodation activity at national, regional, and lower levels. Statistics include guest night numbers, capacity, and occupancy rates.
Immigration New Zealand provides data for people arriving in New Zealand on visas.